Introduction to Geospatial Data Visualization with R
Martin Schweinberger
2024-11-05

Introduction
This tutorial introduces geospatial data visualization in R.

This tutorial is aimed at beginners and intermediate users of R with the aim of showcasing how to visualize geospatial data, i.e. how to generate maps in R, and how to prepare data for geospatial visualizations using R. The aim is not to provide a fully-fledged analysis but rather to show and exemplify selected useful methods associated with generating maps. Very recommendable and detailed resources for geospatial data visualization using R can be found here, here, or here. If you are interested in cartography, here is a cheat sheet for cartography with R.
The entire R Notebook for the tutorial can be downloaded here.
If you want to render the R Notebook on your machine, i.e. knitting the
document to html or a pdf, you need to make sure that you have R and
RStudio installed and you also need to download the bibliography
file and store it in the same folder where you store the
Rmd file.
Preparation and session set up
This tutorial is based on R. If you have not installed R or are new to it, you will find an introduction to and more information how to use R here. For this tutorials, we need to install certain packages from an R library so that the scripts shown below are executed without errors. Before turning to the code below, please install the packages by running the code below this paragraph. If you have already installed the packages mentioned below, then you can skip ahead and ignore this section. To install the necessary packages, simply run the following code - it may take some time (between 1 and 5 minutes to install all of the libraries so you do not need to worry if it takes some time).
NOTE
The installation of the packages will be relatively
data intensive due to some of the required packages containing shp-files
(shape files) - which renders these packages to be larger big in
comparison to other R packages. It is thus recommendable to be logged
into an institutional network that has a decent connectivity and
download rate (e.g., a university network).
install.packages("sf")
install.packages("raster")
install.packages("dplyr")
install.packages("spData")
install.packages("tmap")
install.packages("leaflet")
install.packages("ggplot2")
install.packages("spDataLarge",
                 repos = "https://nowosad.github.io/drat/", type = "source")
install.packages("ggspatial")
install.packages("rnaturalearth")
install.packages("rnaturalearthdata")
install.packages("ggmap")
install.packages("leaflet")
install.packages("scales")
install.packages("maps")
install.packages("here")
install.packages("oz")
# install klippy for copy-to-clipboard button in code chunks
install.packages("remotes")
remotes::install_github("rlesur/klippy")
devtools::install_github("cran/maptools")
devtools::install_github("cran/rgeos")
devtools::install_github("freysimon/TigR")
#install.packages("rgdal", repos="https://cloud.r-project.org/")
Now that we have installed the packages, we activate them as shown below.
library(sf)
library(raster)
library(dplyr)
library(spData)
library(spDataLarge)
library(tmap)
library(ggplot2)
library(ggspatial)
library(rnaturalearth)
library(ggmap)
library(leaflet)
library(maptools)
library(scales)
library(rgeos)
library(oz)
library(TigR)
# activate klippy for copy-to-clipboard button
klippy::klippy()
Once you have installed R and RStudio and also initiated the session by executing the code shown above, you are good to go.
Creating Basic Maps
We will start by generating maps of the world using a in-build
world data set that is part of the spData
package and the plot function for generating the map.
# Load the world data package
data(world)
plot(world)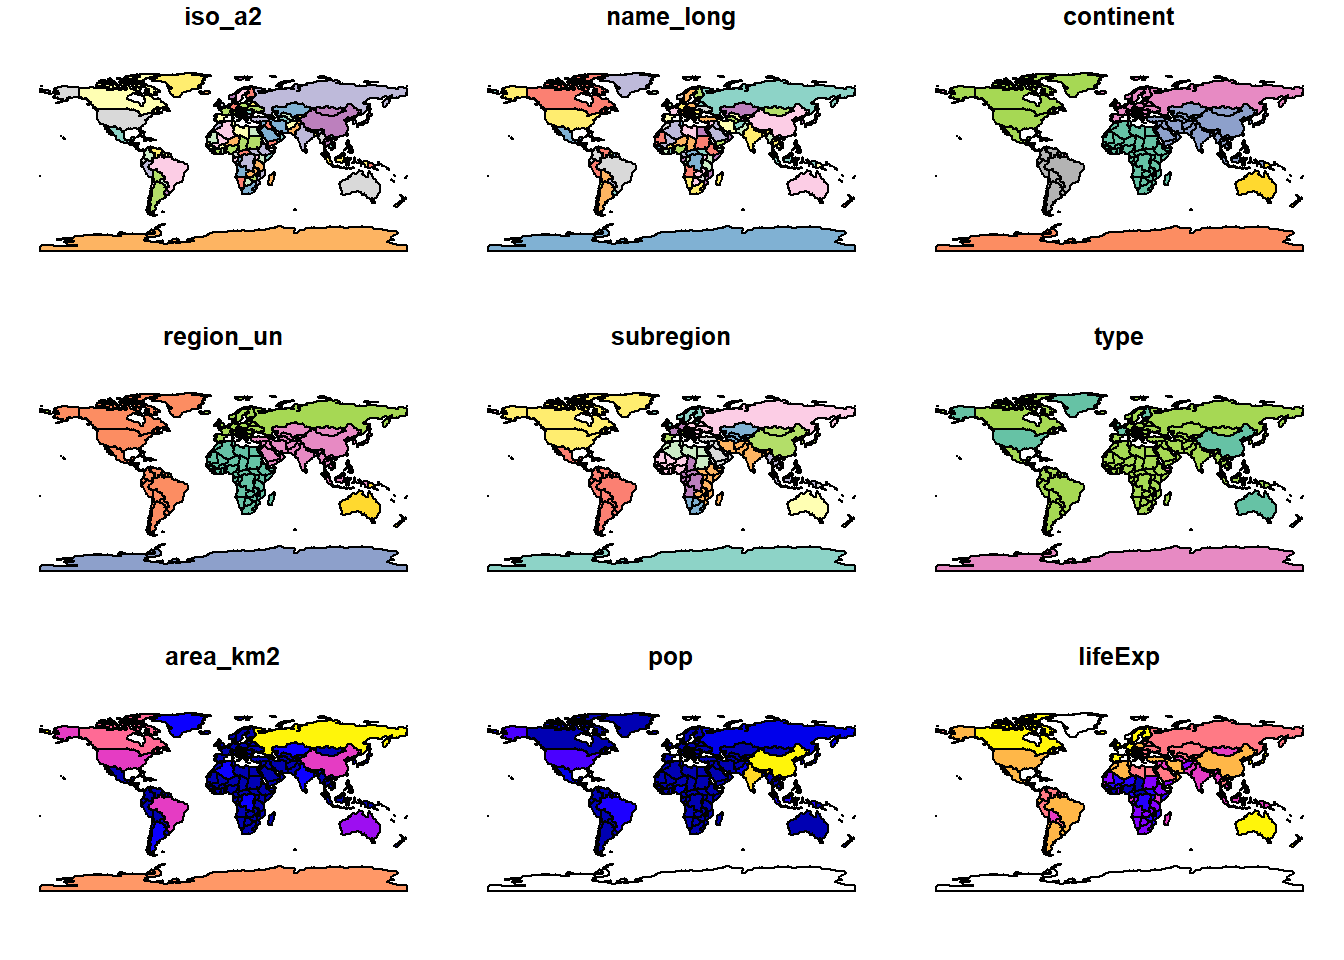
We see that the world data set contains information on
various factors, such as information about regions (e.g.,
continent or subregion), country names
(name_long), population size (pop) or life
expectancy (lifeExp). We can use this information to show a
specific map as shown below.
plot(world["lifeExp"])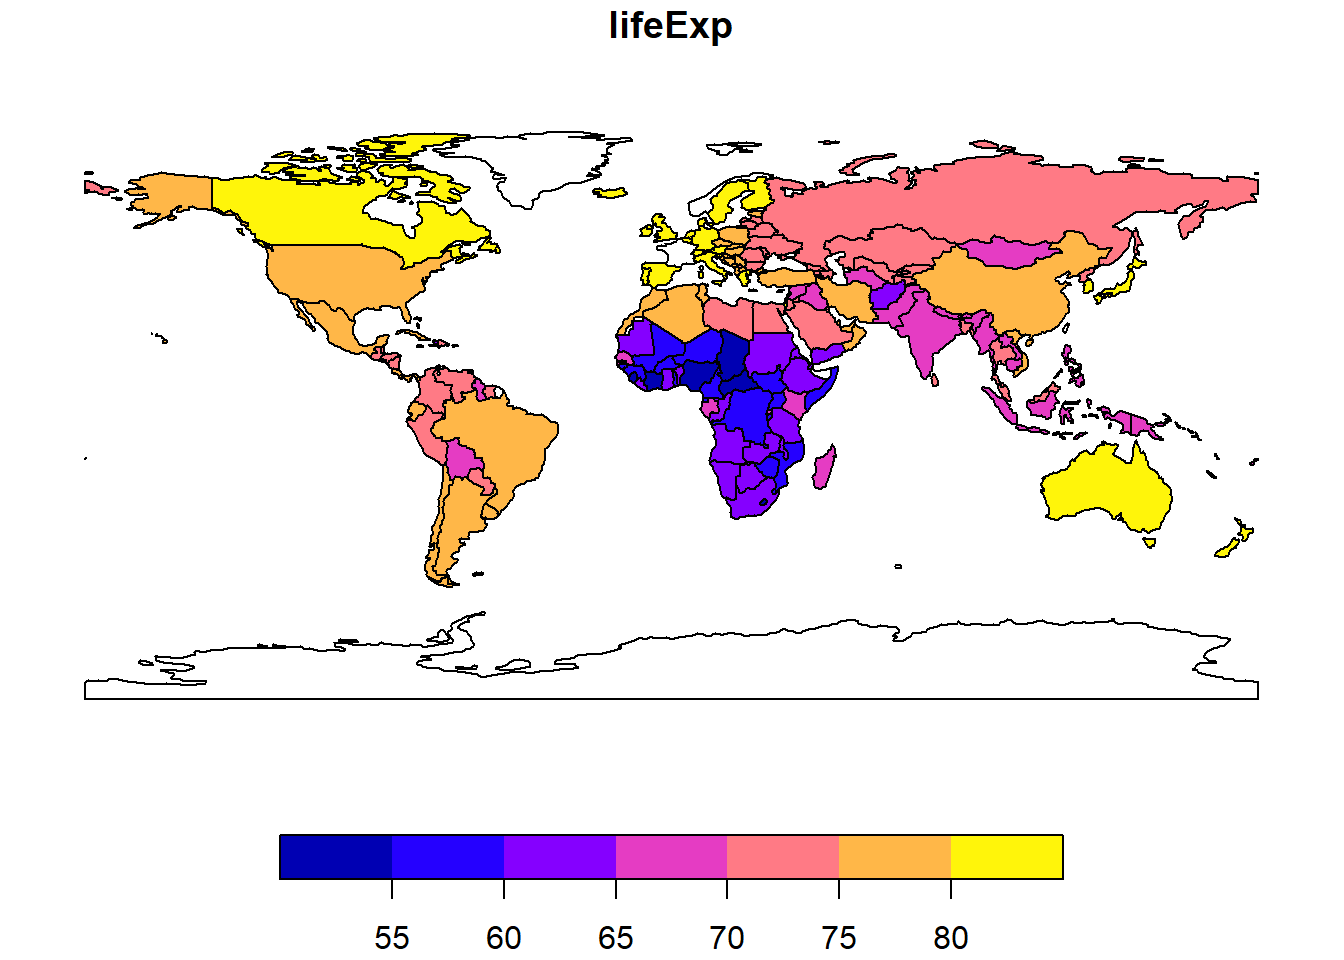
We can use the world data set and filter for specific
features, e.g., we can visualize only a single continent by filtering
for the continent we are interested in. In addition, we define the
x-axis and y-axis limits so that we zoom in on the region of
interest.
# extract europe (exclude russia and iceland)
world_eur <- world %>%
  dplyr::filter(continent == "Europe",
                name_long != "Russian Federation",
                name_long != "Iceland") %>%
  dplyr::select(name_long, geom)
# plot
plot(world_eur,
     xlim = c(5, 10),
     ylim = c(30, 70),
     main = "")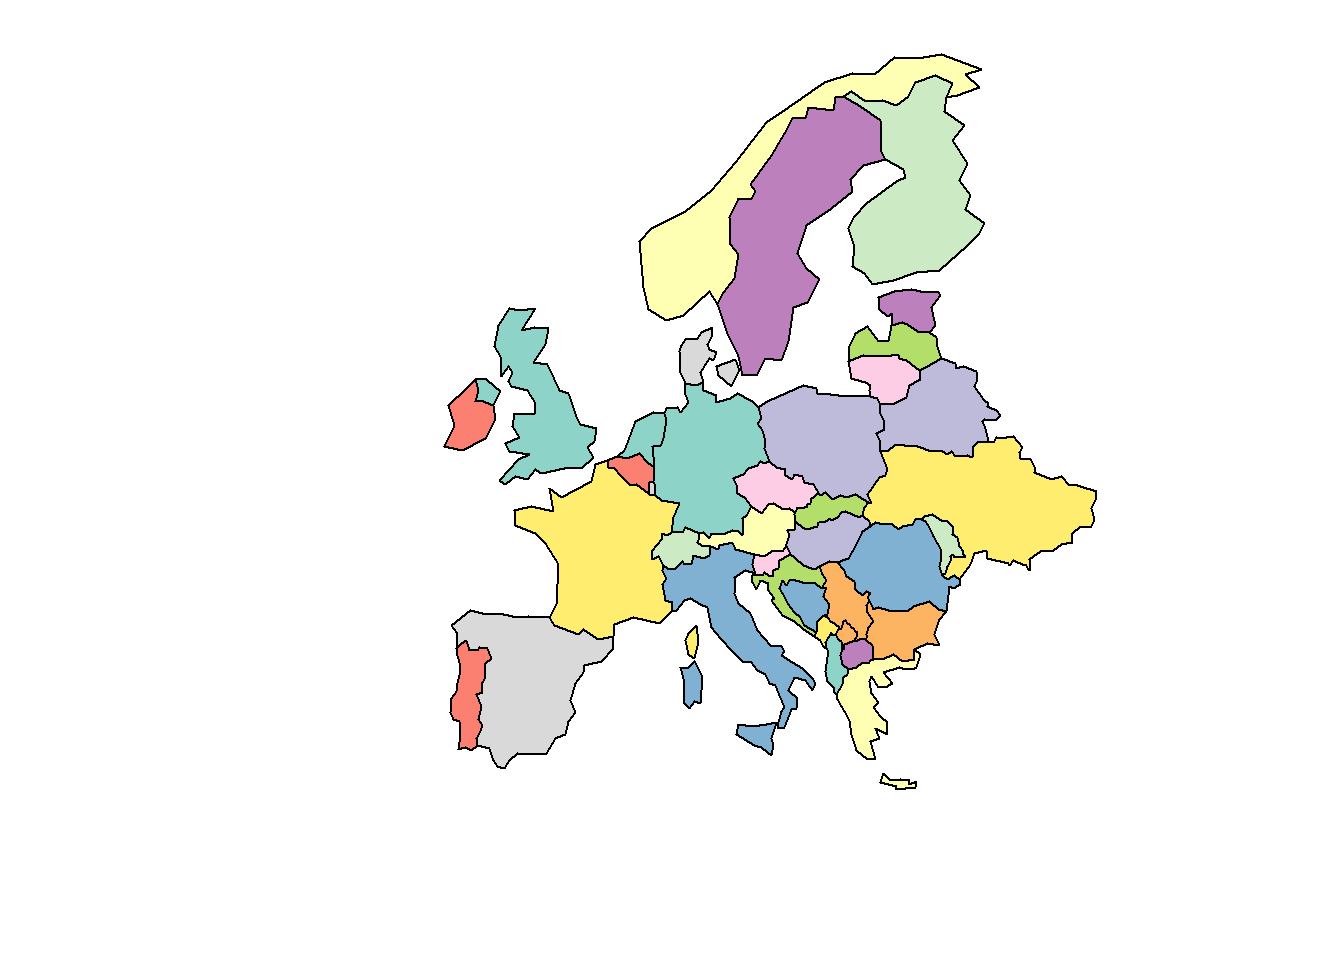
We can also overlay information such as population size over continents and countries as shown below.
# plot world map
plot(world["continent"], reset = FALSE)
# define size bases on population size
cex <- sqrt(world$pop) / 10000
# center world map
world_cents <- sf::st_centroid(world, of_largest = TRUE)
# plot
plot(sf::st_geometry(world_cents),
     add = TRUE,
     cex = cex)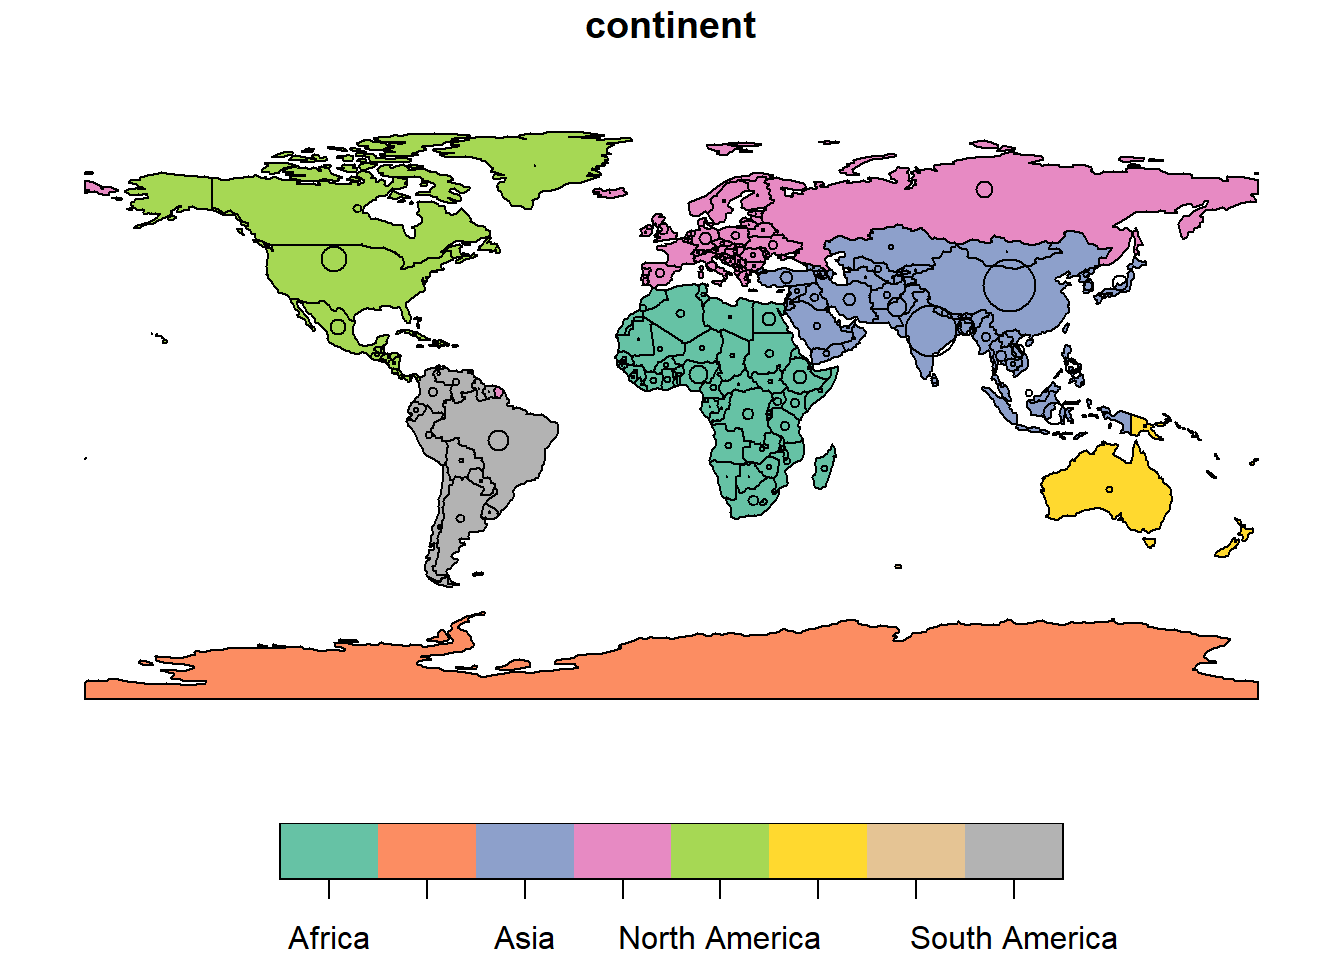
Overlaying is interesting because it allows us to highlight certain regions or countries as shown below.
# extract map of europe
world_eur <- world %>%
  dplyr::filter(continent == "Europe")
# extract germany
ger <- world %>%
  dplyr::filter(name_long == "Germany")
# plot germany
plot(sf::st_geometry(ger), expandBB = c(.2, .2, .2, .2), col = "gray", lwd = 3)
# plot europe
plot(world_eur[0], add = TRUE)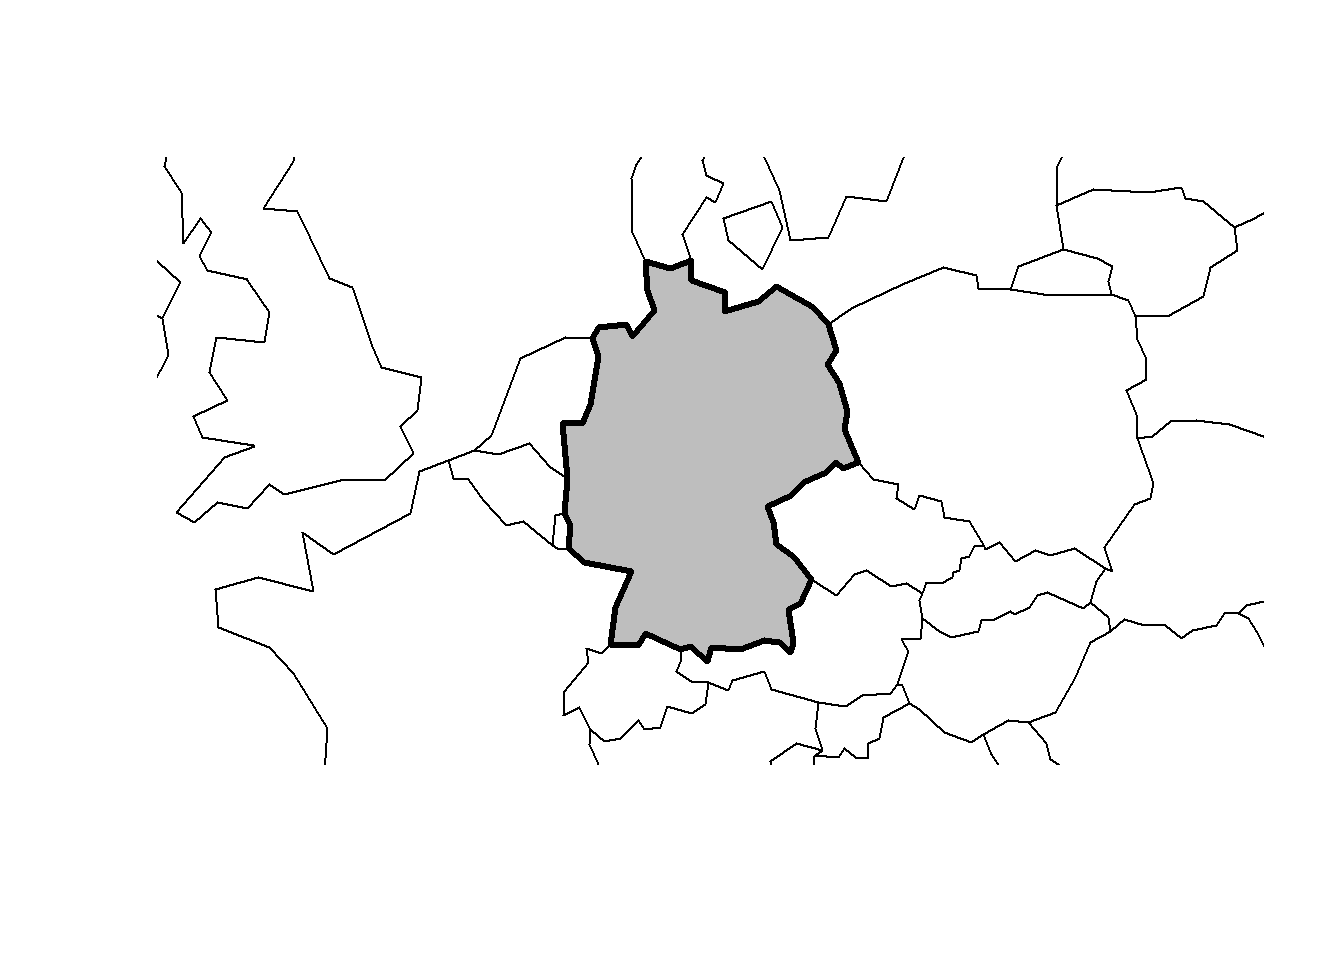
We can also add information to the world data set and
use the added information to generate customized plots.
# countries I have been to
countries <- c("United States", "Norway", "France", "United Arab Emirates",
             "Qatar", "Sweden", "Poland", "Austria", "Hungary", "Romania",
             "Germany", "Bulgaria", "Greece", "Turkey", "Croatia",
             "Switzerland", "Belgium", "Netherlands", "Spain", "Ireland",
             "Australia", "China", "Italy", "Denmark", "United Kingdom",
             "Slovenia", "Finland", "Slovakia", "Czech Republic", "Japan",
             "Saudi Arabia", "Serbia")
# data frame with countries I have visited
visited <- world %>%
  dplyr::filter(name_long %in% countries)
# plot world
plot(world[0], col = "lightgray")
# overlay countries I have visited in orange
plot(sf::st_geometry(visited), add = TRUE, col = "orange")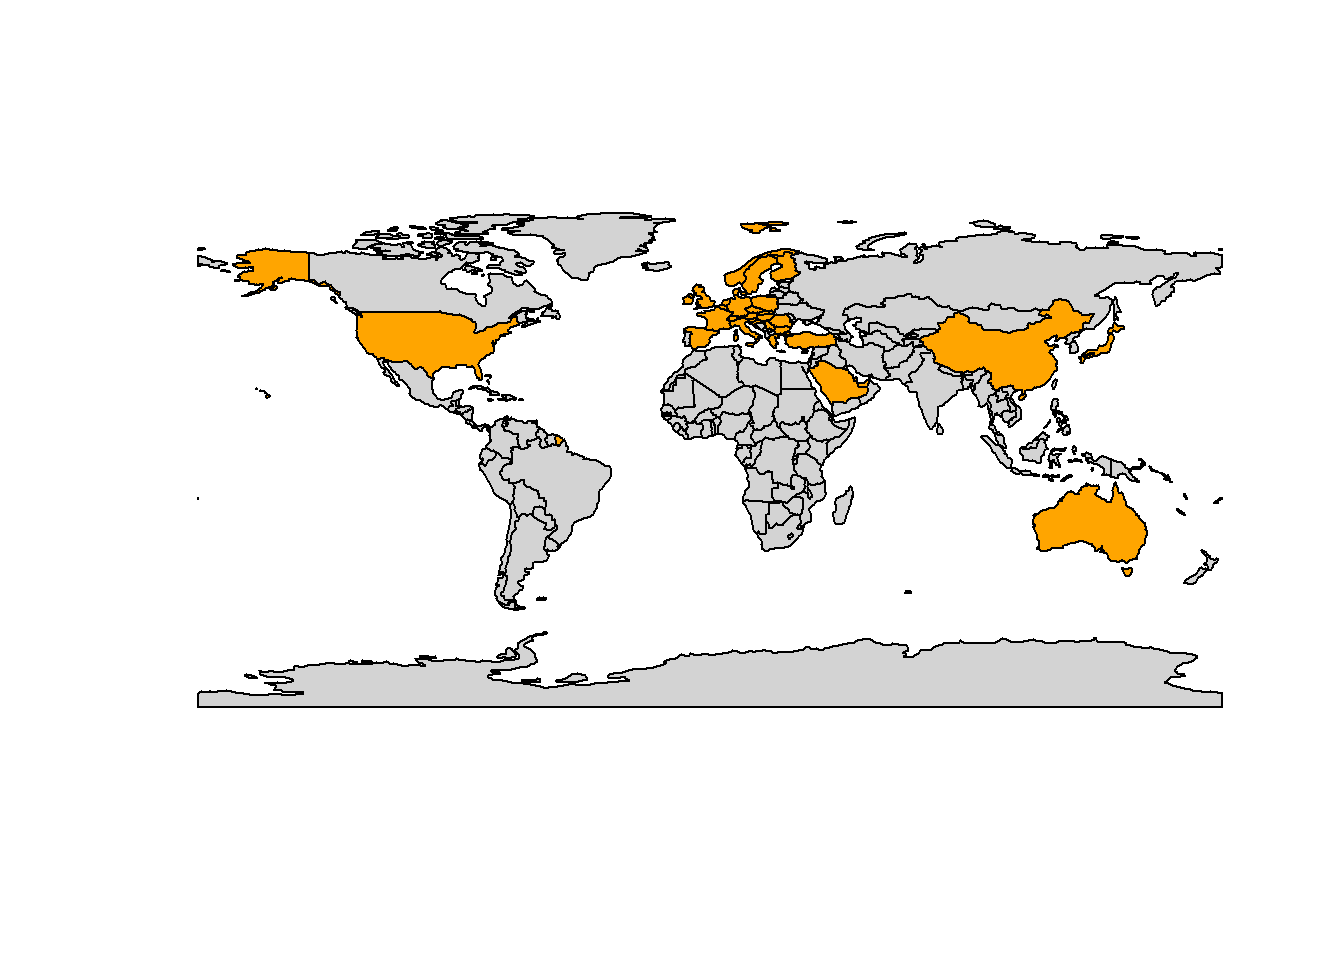
If you want to plot Australia, you can also simply use the
oz package.
Creating Maps with ggplot2
So far, we have used the base plot function to generate
maps. However, it is also possible to use ggplot2 to
generate maps and the easiest way is to use borders to draw
a map.
# plot map
ggplot() +
  borders()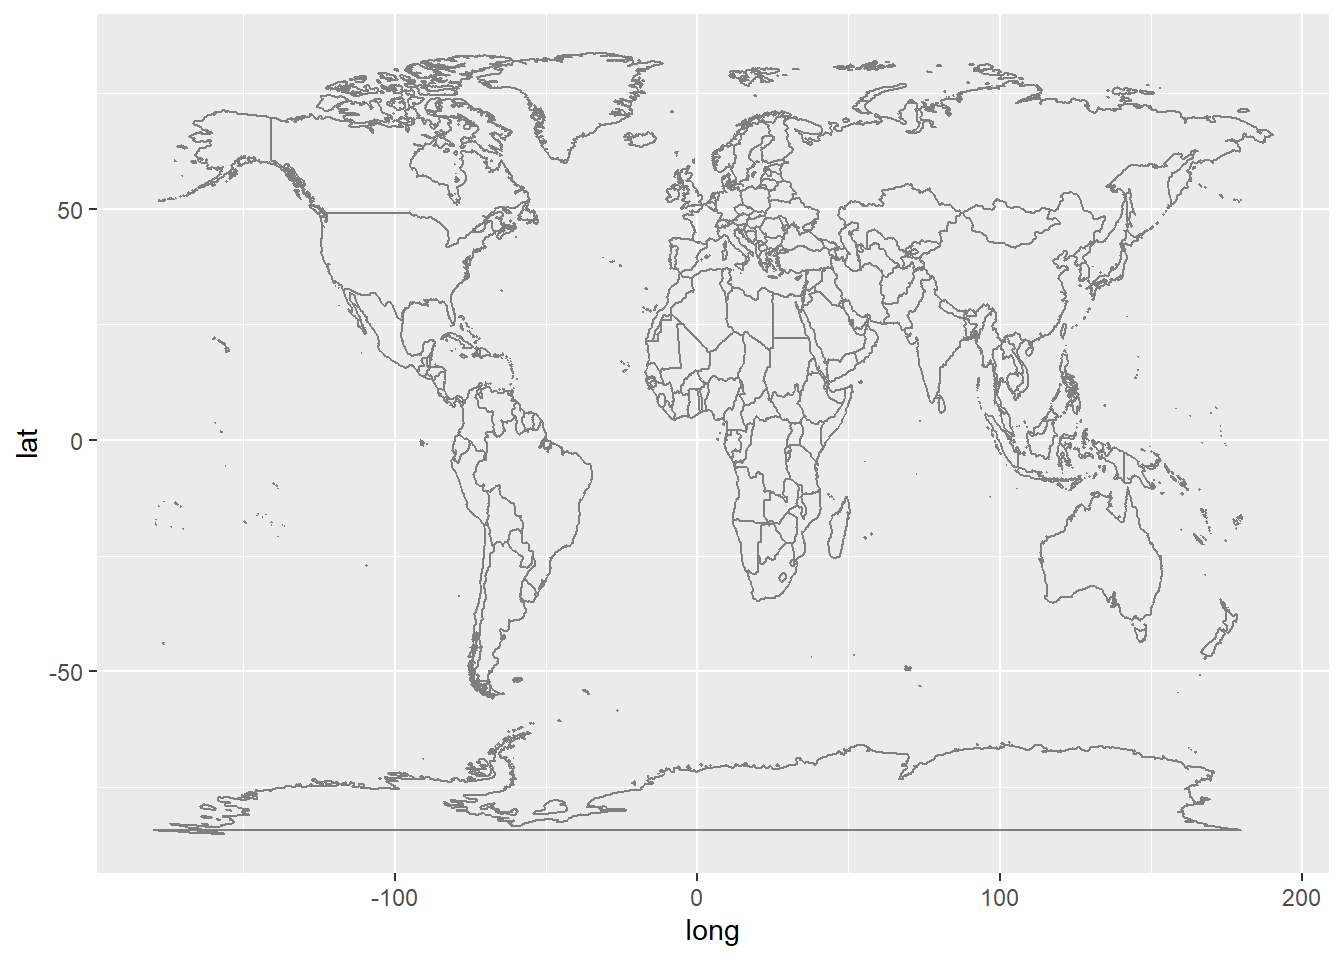
Another option is to add geom_sf to a
ggplot2 object as shown below. A nice feature is that we
can add perspective and projection.
# plot map
ggplot(data = world) +
  geom_sf(fill = "white") +
  coord_sf(crs = "+proj=laea +lat_1=-28 +lat_2=-36 +lat_0=-32 +lon_0=135 +x_0=1000000 +y_0=2000000 +ellps=GRS80 +towgs84=0,0,0,0,0,0,0 +units=m +no_defs")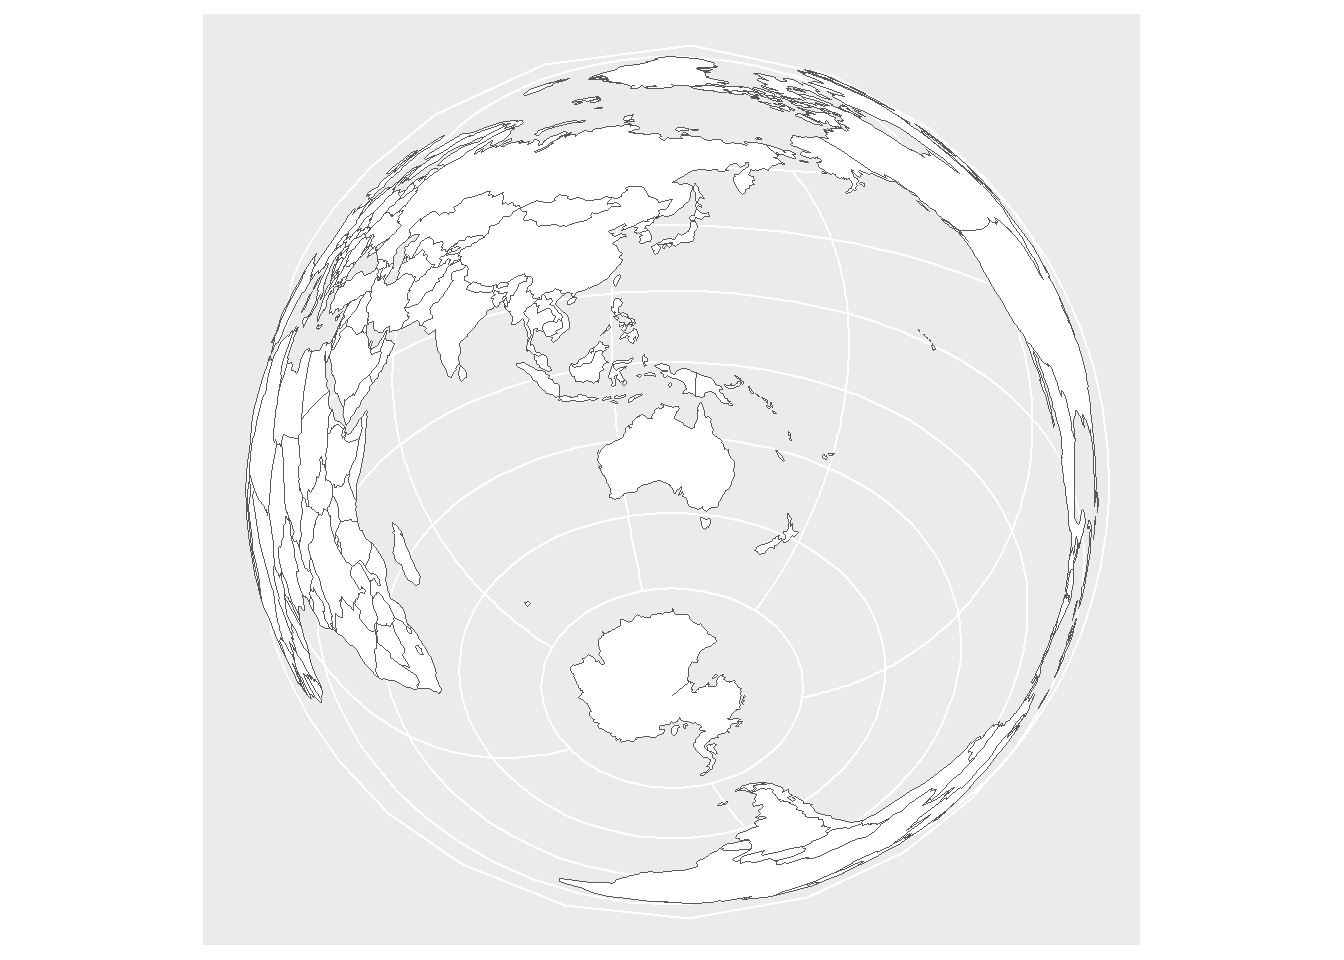
Or have a map that shows the world in a bit of an unusual perspective due to the Labert projection.
# plot map
ggplot(data = world) +
  geom_sf(fill = "beige") +
  coord_sf(crs = "+proj=lcc +lat_1=-28 +lat_2=-36 +lat_0=-32 +lon_0=135 +x_0=1000000 +y_0=2000000 +ellps=GRS80 +towgs84=0,0,0,0,0,0,0 +units=m +no_defs") +
  theme(panel.grid.major = element_line(color = "gray50",
                                         size = 0.25),
        panel.background = element_rect(fill = "aliceblue"))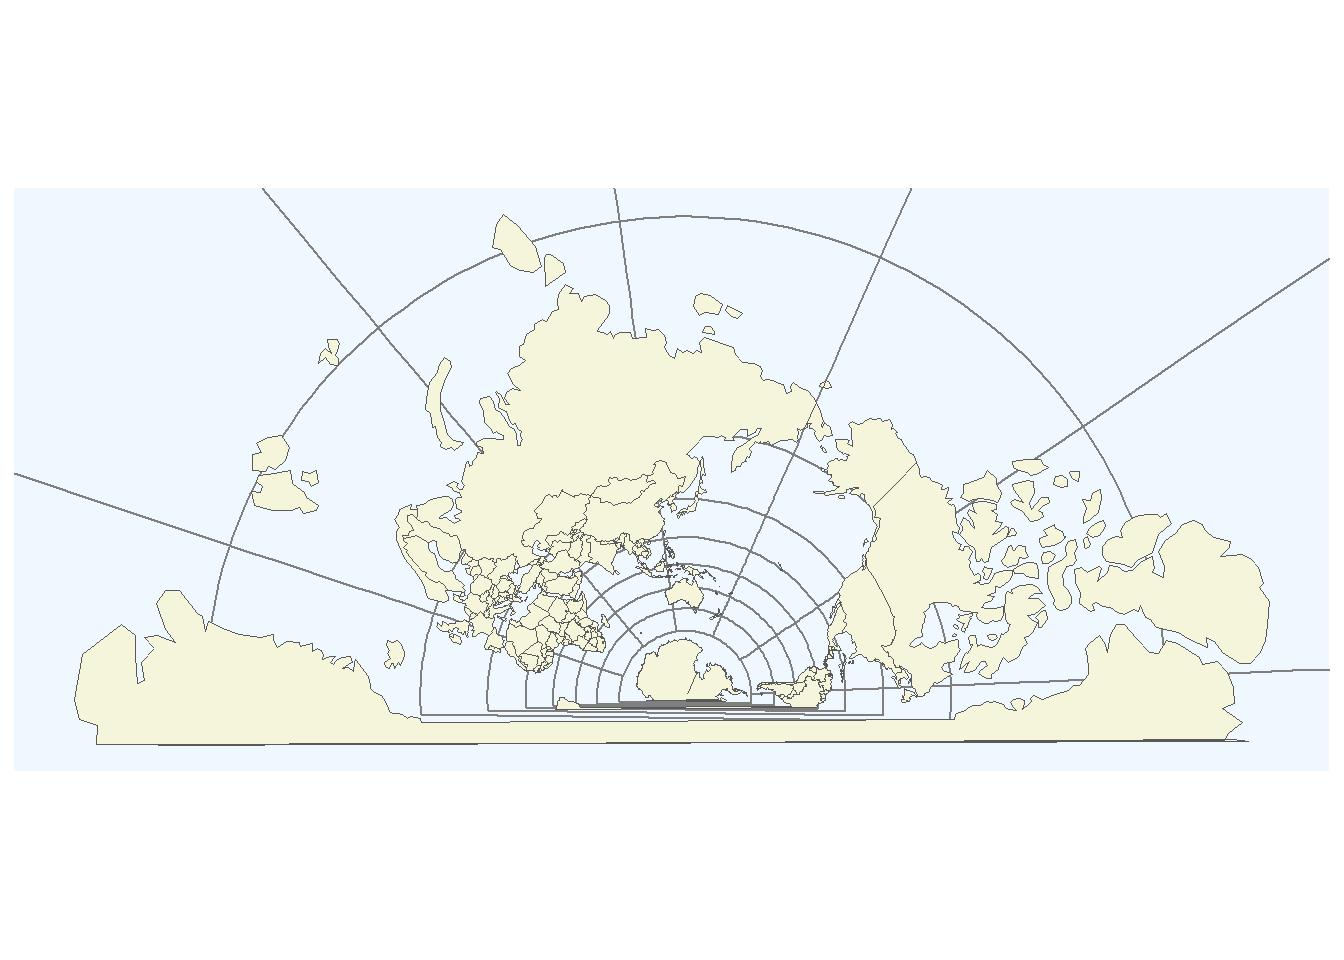
The nice thing about ggplot2 is, of course, that it is
very easy to add layers and create very pretty visualizations.
# plot map
ggplot(data = world) +
  geom_sf() +
  theme_bw() +
  # adding axes title
  labs(x = "Longitude", y = "Latitude") +
  # adding title and subtitle
  ggtitle("A map of Australia") +
  # defining coordinates
  coord_sf(xlim = c(100.00, 160.00),
           ylim = c(-45.00, -10.00),
           expand = T) +
  # add distance measure
  annotation_scale(location = "bl", width_hint = 0.5) +
  # add compass
  annotation_north_arrow(location = "br")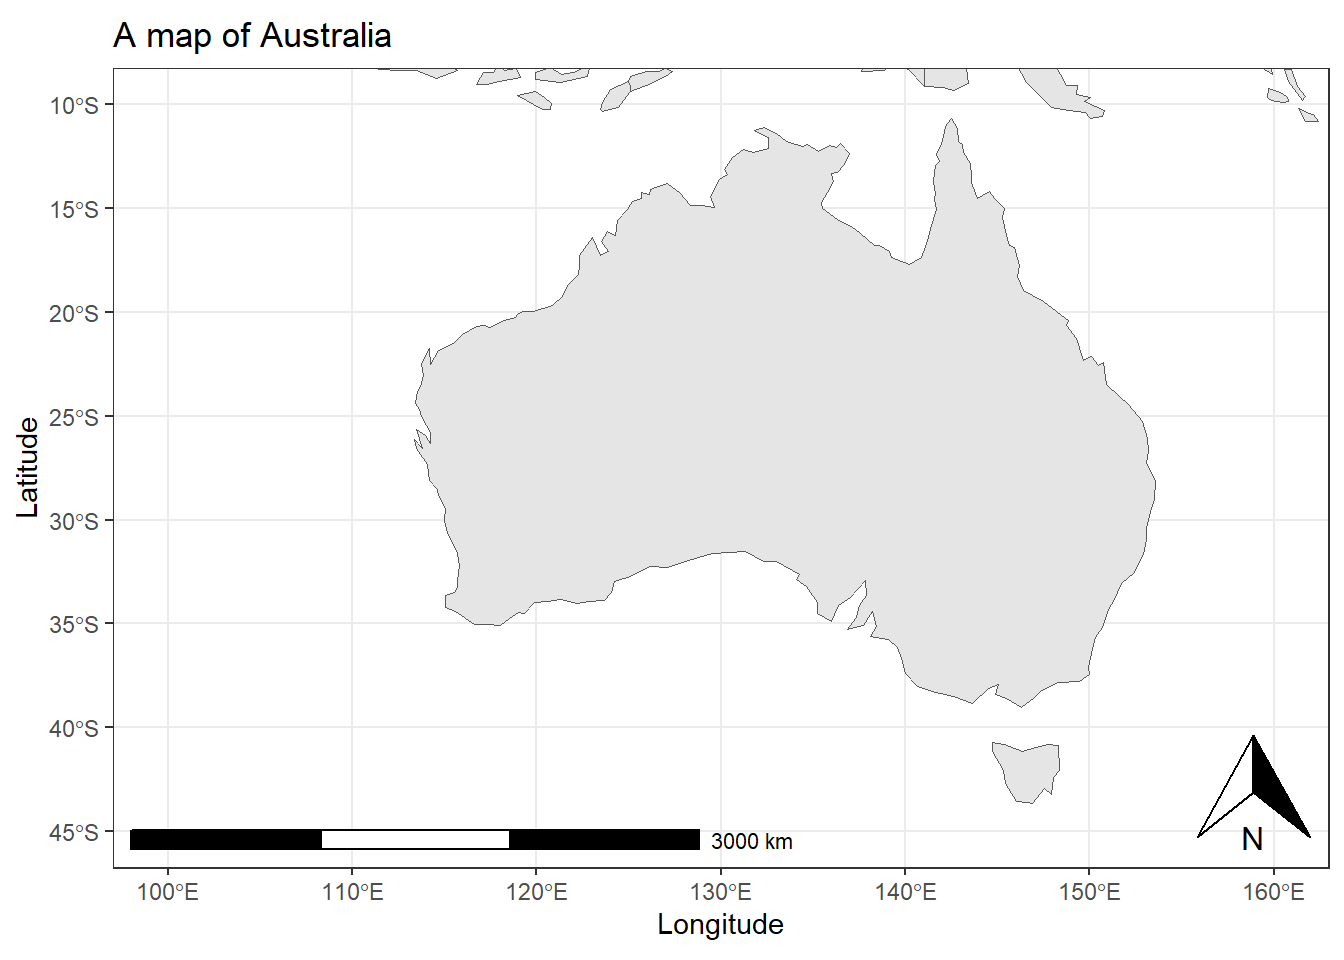
Again, we can customize the map according to what we want. In
addition, we load a map with a higher resolution using the
ne_countries function from the rnaturalearth
package.
# load data
world <- rnaturalearth::ne_countries(returnclass = "sf")
# add to prevent errors
sf::sf_use_s2(FALSE)
# extract locations
world_points<- st_centroid(world)
# extract labels
world_points <- cbind(world, sf::st_coordinates(sf::st_centroid(world$geometry)))
# generate annotated world map
ggplot(data = world) +
  # land is gray
  geom_sf(fill= "gray90") +
  # axes labels
  labs(x = "Longitude", y = "Latitude") +
  # define zoom
  coord_sf(xlim = c(100.00, 180.00),
           ylim = c(-45.00, -10.00), expand = T) +
  # add scale bar
  annotation_scale(location = "bl", width_hint = 0.5) +
  # add compass
  annotation_north_arrow(location = "br", which_north = "true",
                         style = north_arrow_fancy_orienteering) +
  # define theme (add grid lines)
  theme(panel.grid.major = element_line(color = "gray60",
                                         linetype = "dashed",
                                         size = 0.25),
        # define background color
         panel.background = element_rect(fill = "aliceblue")) +
  # add text
  geom_text(data= world_points,aes(x=X, y=Y, label=name),
            color = "gray20", fontface = "italic", check_overlap = T, size = 3)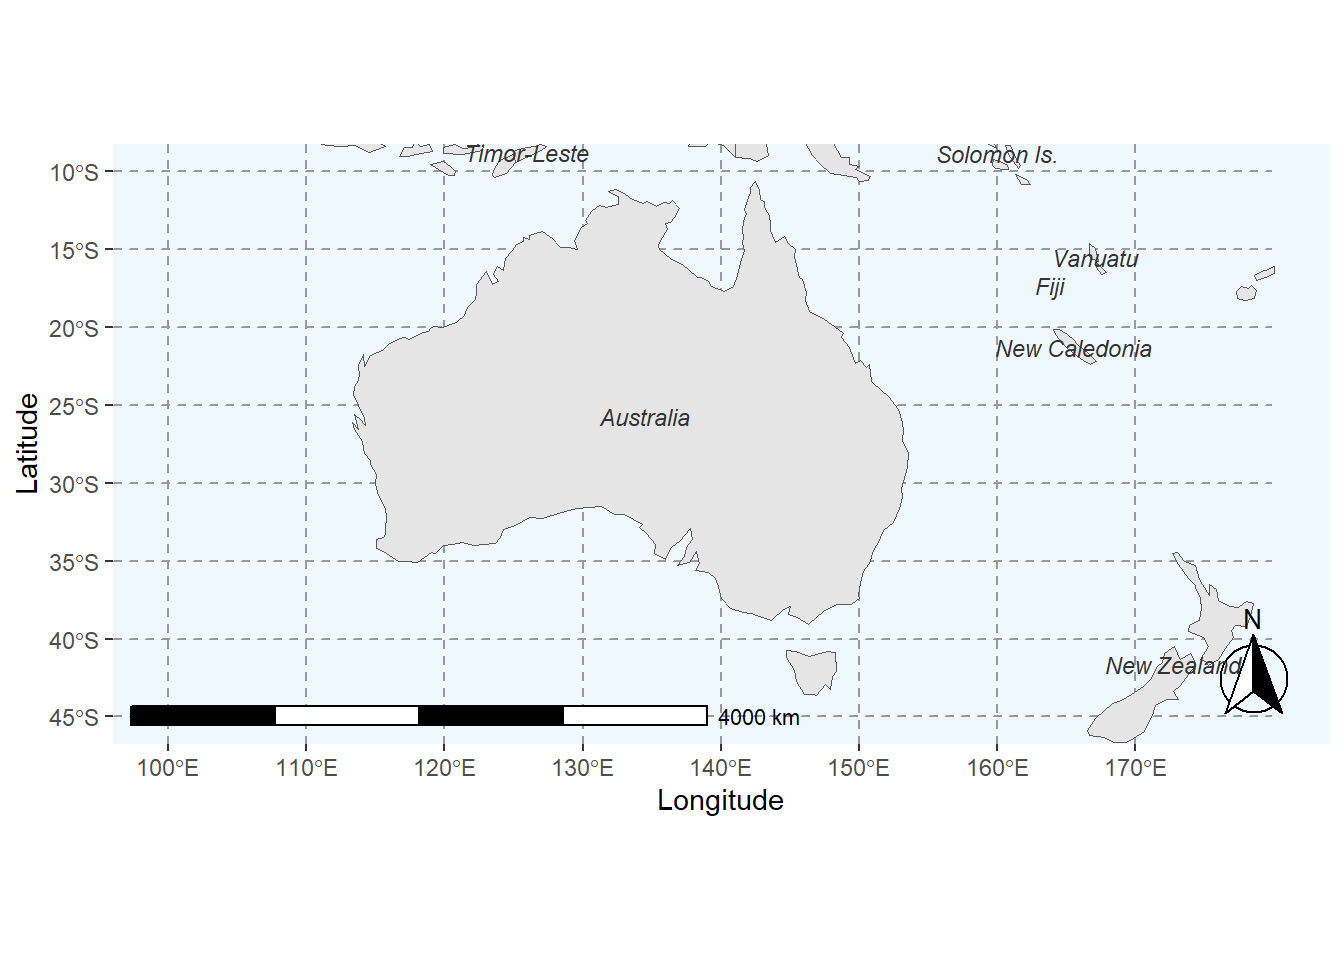
We can explore other designs and maps and show different regions of the world.
# load data
europe <- ne_countries(scale = "medium", continent='europe', returnclass = "sf")
# plot map
ggplot(data = europe) +
  # add map and define filling
  geom_sf(mapping = aes(fill = ifelse(name_long == "Germany", "0", "1"))) +
  # simply black and white background
  theme_bw() +
  # adding axes title
  labs(x = "Longitude", y = "Latitude") +
  # adding title and subtitle
  ggtitle("A map of central Europe") +
  # defining coordinates
  coord_sf(xlim = c(-10, 30),
           ylim = c(40, 60)) +
  # add distance measure
  annotation_scale(location = "bl", width_hint = 0.5) +
  # add compass
  annotation_north_arrow(location = "br",
                         # make compass fancy
                         style = north_arrow_fancy_orienteering) +
  theme(legend.position = "none",
        # add background color
        panel.background = element_rect(fill = "lightblue"),
        # remove grid lines
        panel.grid.major = element_blank(),
        panel.grid.minor = element_blank()) +
  # define fill colors
  scale_fill_manual(name = "Country", values = c("darkgray", "beige")) +
  # add text
  geom_sf_text(aes(label = name_long), size=2.5, color = "gray20")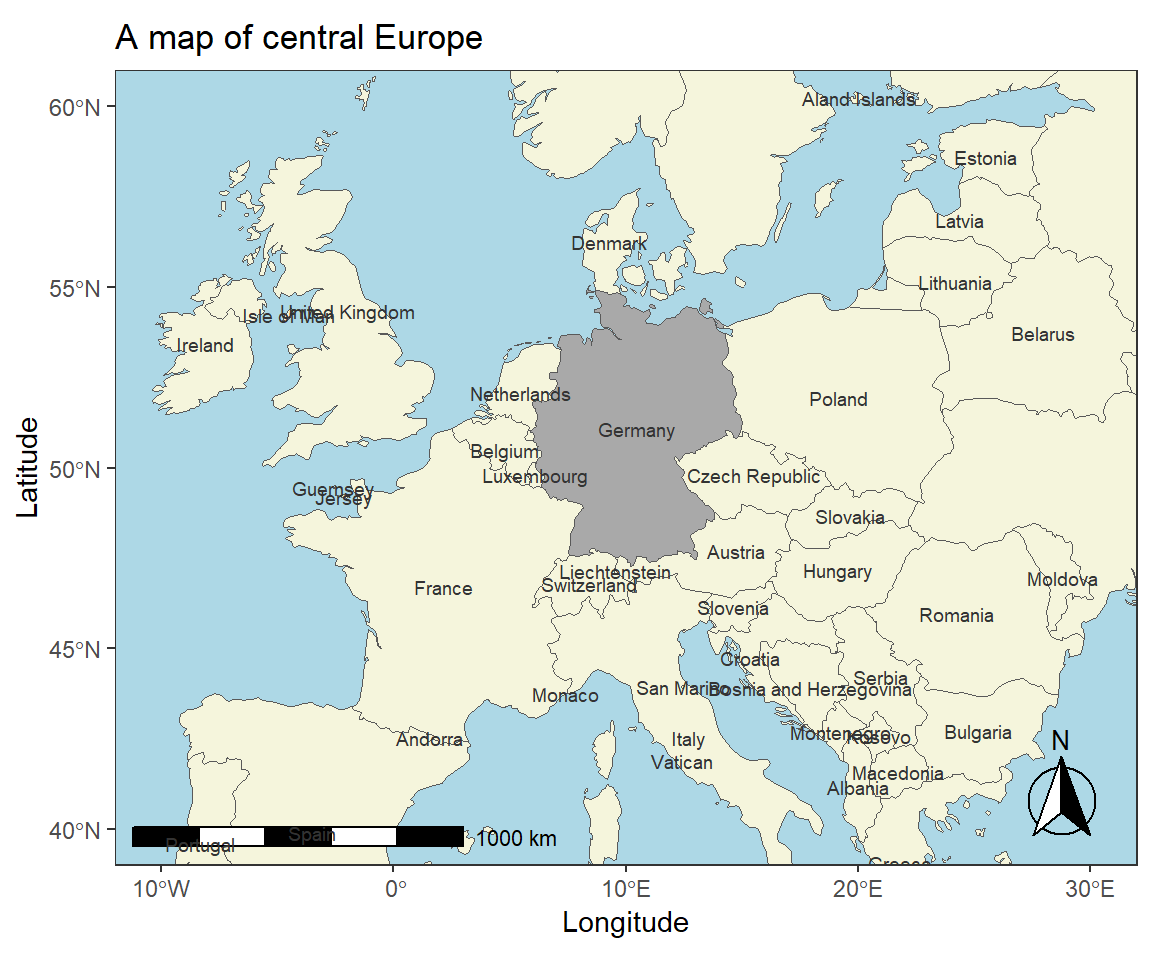
Adding External Information
While being very useful, displaying basic maps is usually less relevant because, typically, we want to add different layers to a map. In order to add layers to a map, we need to combine the existing data with some data that we would like to lay over the existing map.
We will now lad external information which contains the locations of Australian airports.
# load data
airports <- base::readRDS(url("https://slcladal.github.io/data/apd.rda", "rb")) %>%
  dplyr::mutate(ID = as.character(ID)) %>%
  dplyr::filter(Country == "Australia")
# inspect
head(airports)
## ID Name City Country Latitude
## 1 3317 Brisbane Archerfield Airport Brisbane Australia -27.5703
## 2 3318 Northern Peninsula Airport Amberley Australia -10.9508
## 3 3319 Alice Springs Airport Alice Springs Australia -23.8067
## 4 3320 Brisbane International Airport Brisbane Australia -27.3842
## 5 3321 Gold Coast Airport Coolangatta Australia -28.1644
## 6 3322 Cairns International Airport Cairns Australia -16.8858
## Longitude
## 1 153.008
## 2 142.459
## 3 133.902
## 4 153.117
## 5 153.505
## 6 145.755Next, we load an additional data set about the route volume of Australian airports (how many routes go in and out of these airports).
# read in routes data
routes <- base::readRDS(url("https://slcladal.github.io/data/ard.rda", "rb")) %>%
  dplyr::rename(ID = destinationAirportID) %>%
  dplyr::group_by(ID) %>%
  dplyr::summarise(flights = n())
# inspect
head(routes)
## # A tibble: 6 × 2
## ID flights
## <chr> <int>
## 1 1 5
## 2 10 2
## 3 100 44
## 4 1001 4
## 5 1004 7
## 6 1005 31We can now merge the airports and the route volume data sets to combine the information about the location with the information about the number of routes that end at each airport.
# combine tables
arrivals <- dplyr::left_join(airports, routes, by = "ID") %>%
  na.omit()
# inspect
head(arrivals)
## ID Name City Country Latitude
## 2 3318 Northern Peninsula Airport Amberley Australia -10.9508
## 3 3319 Alice Springs Airport Alice Springs Australia -23.8067
## 4 3320 Brisbane International Airport Brisbane Australia -27.3842
## 5 3321 Gold Coast Airport Coolangatta Australia -28.1644
## 6 3322 Cairns International Airport Cairns Australia -16.8858
## 7 3323 Charleville Airport Charlieville Australia -26.4133
## Longitude flights
## 2 142.459 1
## 3 133.902 13
## 4 153.117 144
## 5 153.505 28
## 6 145.755 54
## 7 146.262 4Now that we have that data (which contains geolocations (longitudes and latitudes), we can visualize the location of the airports on a map and add information about the route volume of the airports in the form of, e.g., points that we plot over the airport - the bigger the point, the higher the route volume. In addition, we add the locations as texts and also make these labels correspond to the route volume.
# create a layer of borders
ggplot(arrivals, aes(x=Longitude, y= Latitude)) +
  borders("world", colour="gray20", fill="wheat1")  +
  geom_point(color="blue", alpha = .3, size = log(arrivals$flights)) +
  scale_x_continuous(name="Longitude", limits=c(110, 160)) +
  scale_y_continuous(name="Latitude", limits=c(-45, -10)) +
  theme(panel.background = element_rect(fill = "azure1", colour = "azure1")) +
  geom_text(aes(x=Longitude, y= Latitude, label=City),
            color = "gray20", check_overlap = T, size = log(arrivals$flights))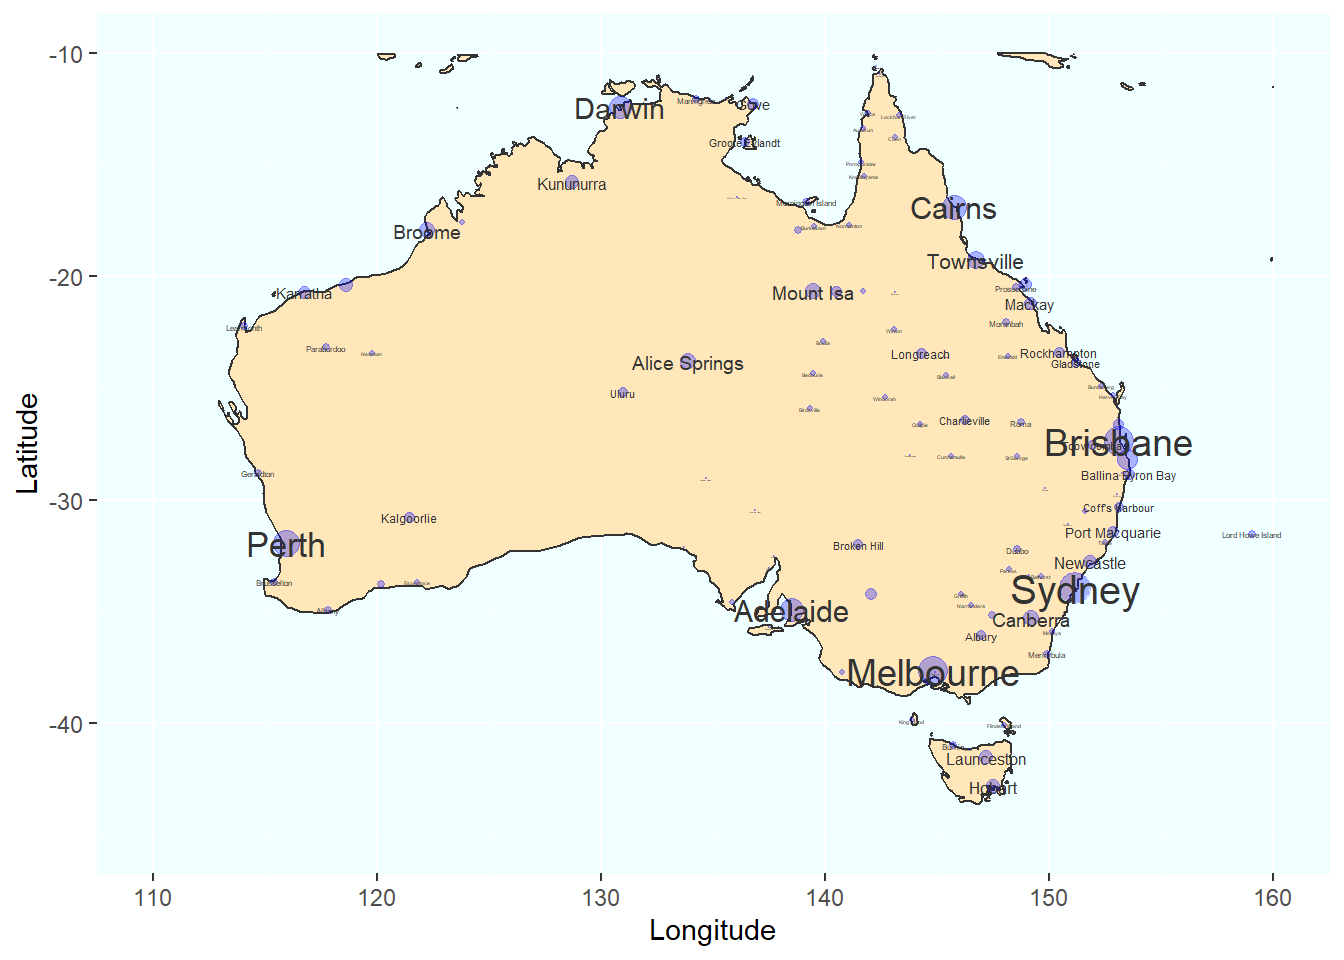
Interactive Maps with leaflet and maptools
The leaflet package offers very easy-to use options for
generating interactive maps (here
is the link to the leaflet cheat sheet provided by RStudio). The
interactivity is achieved by the leaflet function from the
leaflet package which creates a leaflet-map with
html-widgets which can be used, e.g., in html rendered R Notebooks or
Shiny applications. The advantage of using this function lies in the
fact that it offers very detailed maps which enable zooming in on
specific locations.
# generate basic leaflet map
m <- leaflet() %>%
  leaflet::setView(lng = 153.05, lat = -27.45, zoom = 12)%>%
  leaflet::addTiles()
# show map
m
Another option for interactive geospatial visualizations is provided
by the maptools package which comes with a
SpatialPolygonsDataFrame of the world and the population by
country (in 2005). To make the visualization a bit more appealing, we
will calculate the population density, add this variable to the data
which underlies the visualization, and then display the information
interactively. In this case, this means that you can use
mouse-over or hoover effects so that you see the
population density in each country if you put the cursor on that country
(given the information is available for that country).
We start by loading the required package from the library, adding population density to the data, and removing data points without meaningful information (e.g. we set values like Inf to NA).
# load data
data(wrld_simpl)
# calculate population density and add it to the data
wrld_simpl@data$PopulationDensity <- round(wrld_simpl@data$POP2005/wrld_simpl@data$AREA,2)
wrld_simpl@data$PopulationDensity <- ifelse(wrld_simpl@data$PopulationDensity == "Inf", NA, wrld_simpl@data$PopulationDensity)
wrld_simpl@data$PopulationDensity <- ifelse(wrld_simpl@data$PopulationDensity == "NaN", NA, wrld_simpl@data$PopulationDensity)
# inspect
head(wrld_simpl@data, 10)
## FIPS ISO2 ISO3 UN NAME AREA POP2005 REGION SUBREGION
## ATG AC AG ATG 28 Antigua and Barbuda 44 83039 19 29
## DZA AG DZ DZA 12 Algeria 238174 32854159 2 15
## AZE AJ AZ AZE 31 Azerbaijan 8260 8352021 142 145
## ALB AL AL ALB 8 Albania 2740 3153731 150 39
## ARM AM AM ARM 51 Armenia 2820 3017661 142 145
## AGO AO AO AGO 24 Angola 124670 16095214 2 17
## ASM AQ AS ASM 16 American Samoa 20 64051 9 61
## ARG AR AR ARG 32 Argentina 273669 38747148 19 5
## AUS AS AU AUS 36 Australia 768230 20310208 9 53
## BHR BA BH BHR 48 Bahrain 71 724788 142 145
## LON LAT PopulationDensity
## ATG -61.783 17.078 1887.25
## DZA 2.632 28.163 137.94
## AZE 47.395 40.430 1011.14
## ALB 20.068 41.143 1151.00
## ARM 44.563 40.534 1070.09
## AGO 17.544 -12.296 129.10
## ASM -170.730 -14.318 3202.55
## ARG -65.167 -35.377 141.58
## AUS 136.189 -24.973 26.44
## BHR 50.562 26.019 10208.28We can now display the data and use color coding to indicate the different population densities.
# define colors
qpal <- colorQuantile(rev(viridis::viridis(10)),
                      wrld_simpl$PopulationDensity, n=10)
# generate visualization
l <- leaflet(wrld_simpl, options =
               leafletOptions(attributionControl = FALSE, minzoom=1.5)) %>%
  addPolygons(
    label=~stringr::str_c(
      NAME, ' ',
      formatC(PopulationDensity, big.mark = ',', format='d')),
    labelOptions= labelOptions(direction = 'auto'),
    weight=1, color='#333333', opacity=1,
    fillColor = ~qpal(PopulationDensity), fillOpacity = 1,
    highlightOptions = highlightOptions(
      color='#000000', weight = 2,
      bringToFront = TRUE, sendToBack = TRUE)
    ) %>%
  addLegend(
    "topright", pal = qpal, values = ~PopulationDensity,
    title = htmltools::HTML("Population density <br> (2005)"),
    opacity = 1 )
# display visualization
l
Adding Shapes to Maps
In order to work with shape files, you need to download the shape file(s) first. You can download the shape file we will be using from the shapes directory in the data folder of the LADAL GitHub repository.
I stored the shape file in my data folder which then
allows me to access the shape file and use it for further
visualizations.
australia <- read_sf(here::here("data/shapes", "AshmoreAndCartierIslands.shp"),
                            layer='AshmoreAndCartierIslands')
We can now generate a first map based on the shape file we downloaded.
ggplot(australia) +
  geom_sf(colour = "black", fill = "gray90") +
  theme_void()
We will end this introduction here but if you want to want to learn more, check out the detailed resources for geospatial data visualization using R can be found here or here.
Citation & Session Info
Schweinberger, Martin. 2024. Introduction to Geospatial Data Visualization with R. Brisbane: The University of Queensland. url: https://slcladal.github.io/gviz.html (Version 2023.02.09).
@manual{schweinberger2023gviz,
  author = {Schweinberger, Martin},
  title = {Introduction to Geospatial Data Visualization with R},
  note = {https://ladal.edu.au/gviz.html},
  year = {2023},
  organization = "The University of Queensland, Australia. School of Languages and Cultures},
  address = {Brisbane},
  edition = {2023.02.09}
}sessionInfo()## R version 4.4.1 (2024-06-14 ucrt)
## Platform: x86_64-w64-mingw32/x64
## Running under: Windows 11 x64 (build 22631)
##
## Matrix products: default
##
##
## locale:
## [1] LC_COLLATE=English_Australia.utf8 LC_CTYPE=English_Australia.utf8
## [3] LC_MONETARY=English_Australia.utf8 LC_NUMERIC=C
## [5] LC_TIME=English_Australia.utf8
##
## time zone: Australia/Brisbane
## tzcode source: internal
##
## attached base packages:
## [1] stats graphics grDevices utils datasets methods base
##
## other attached packages:
## [1] TigR_0.4.0.12 oz_1.0-22 rgeos_0.6-4
## [4] scales_1.3.0 maptools_1.1-8 leaflet_2.2.2
## [7] ggmap_4.0.0 rnaturalearth_1.0.1 ggspatial_1.1.9
## [10] ggplot2_3.5.1 tmap_3.3-4 spDataLarge_2.1.2
## [13] spData_2.3.3 dplyr_1.1.4 raster_3.6-30
## [16] sp_2.1-4 sf_1.0-18
##
## loaded via a namespace (and not attached):
## [1] DBI_1.2.3 bitops_1.0-9 pbapply_1.7-2
## [4] gridExtra_2.3 tmaptools_3.1-1 s2_1.1.7
## [7] rlang_1.1.4 magrittr_2.0.3 e1071_1.7-16
## [10] compiler_4.4.1 maps_3.4.2 png_0.1-8
## [13] vctrs_0.6.5 stringr_1.5.1 wk_0.9.4
## [16] pkgconfig_2.0.3 fastmap_1.2.0 labeling_0.4.3
## [19] lwgeom_0.2-14 leafem_0.2.3 utf8_1.2.4
## [22] rmarkdown_2.28 purrr_1.0.2 xfun_0.49
## [25] cachem_1.1.0 jsonlite_1.8.9 highr_0.11
## [28] jpeg_0.1-10 terra_1.7-83 parallel_4.4.1
## [31] R6_2.5.1 dygraphs_1.1.1.6 bslib_0.8.0
## [34] stringi_1.8.4 RColorBrewer_1.1-3 parallelly_1.38.0
## [37] jquerylib_0.1.4 stars_0.6-6 assertthat_0.2.1
## [40] Rcpp_1.0.13-1 knitr_1.48 future.apply_1.11.3
## [43] klippy_0.0.0.9500 zoo_1.8-12 base64enc_0.1-3
## [46] R.utils_2.12.3 leaflet.providers_2.0.0 tidyselect_1.2.1
## [49] viridis_0.6.5 rstudioapi_0.17.1 dichromat_2.0-0.1
## [52] abind_1.4-8 yaml_2.3.10 codetools_0.2-20
## [55] listenv_0.9.1 lattice_0.22-6 tibble_3.2.1
## [58] leafsync_0.1.0 plyr_1.8.9 withr_3.0.2
## [61] evaluate_1.0.1 hydroTSM_0.7-0.1 foreign_0.8-87
## [64] future_1.34.0 rnaturalearthdata_1.0.0 units_0.8-5
## [67] proxy_0.4-27 xts_0.14.1 pillar_1.9.0
## [70] KernSmooth_2.23-24 generics_0.1.3 rprojroot_2.0.4
## [73] munsell_0.5.1 globals_0.16.3 class_7.3-22
## [76] glue_1.8.0 tools_4.4.1 data.table_1.16.2
## [79] XML_3.99-0.17 grid_4.4.1 tidyr_1.3.1
## [82] crosstalk_1.2.1 hydroGOF_0.6-0.1 colorspace_2.1-1
## [85] cli_3.6.3 fansi_1.0.6 viridisLite_0.4.2
## [88] gtable_0.3.5 R.methodsS3_1.8.2 sass_0.4.9
## [91] digest_0.6.37 classInt_0.4-10 farver_2.1.2
## [94] htmlwidgets_1.6.4 htmltools_0.5.8.1 R.oo_1.27.0
## [97] lifecycle_1.0.4 here_1.0.1 httr_1.4.7