TUTORIALS
60+ free tutorials covering data science, statistics, visualisation, and text analytics in R

Welcome to LADAL Tutorials!
Ready to explore data science, statistics, and text analysis?
Our tutorials guide you from beginner basics to advanced research methods — covering everything from fundamental R programming to cutting-edge natural language processing. Whether you are a complete beginner or an experienced researcher expanding your toolkit, LADAL has a path for you.
Quick Decision Guide
- Do you know R?
- ❌ No → R Basics first
- ✅ Yes → continue below
- What is your goal?
- 📥 Get data into R → Data Collection and Acquisition
- 📊 Build visualisations → Data Visualization
- 📈 Run statistical models → Statistics
- 📝 Analyse text → Text Analytics
- 🔬 See complete research examples → look for Showcase entries in any section
- What is your level?
- Beginner → start at the top of your chosen section
- Intermediate → jump to specific subsections
- Advanced → go directly to the ⭐⭐⭐ tutorials or Showcase entries
Tutorial Categories
| Section | Focus | Core tutorials | Showcases & How-Tos |
|---|---|---|---|
| Data Science Basics | Conceptual foundations for digital research | 5 | — |
| R Basics | R programming fundamentals | 7 | 3 How-Tos |
| Data Collection & Acquisition | Collecting and importing data | 1 | 4 How-Tos |
| Data Visualization | Publication-quality figures | 4 | 3 Showcases |
| Statistics | Descriptive stats to advanced modelling | 13 | 4 Showcases |
| Text Analytics | Computational text analysis | 17 | 6 Showcases |
Data Science Basics

What you will learn: Best practices for digital research, reproducibility, and quantitative reasoning
Prerequisites: None — perfect for complete beginners
Typical time: 5–8 hours total
Why start here: These tutorials provide the conceptual foundations that make all the practical tutorials more meaningful. You can jump straight into R if you prefer, but returning to this section will deepen your understanding.
Tutorials
1. Working with Computers
Learn how to keep your computer clean and running smoothly, organise files and folders systematically, and store data safely. Good digital hygiene prevents data loss and saves time.
Time: ~1 hour · Prerequisites: None
2. Introduction to Data Management
Basic data management techniques: folder organisation, file naming conventions, and data documentation practices. Clean data management is the foundation of reproducible research.
Time: ~1 hour · Prerequisites: None
3. Reproducible Research
Principles of reproducibility, version control basics, documentation strategies, and how to build reproducible workflows. Reproducibility is increasingly required by journals and funders.
Time: ~1.5 hours · Prerequisites: None
4. Introduction to Quantitative Reasoning
A philosophical and history-of-ideas approach to the logical and cognitive underpinnings of the scientific method. Understanding why helps you apply methods appropriately.
Time: ~2 hours · Prerequisites: None
5. Basic Concepts in Quantitative Research
Fundamental concepts in data analysis: variables, observations, measurements, descriptive vs. inferential statistics, and research design basics. These concepts underpin all statistical methods.
Time: ~2 hours · Prerequisites: None
- Working with Computers + Data Management — practical skills first
- Reproducible Research — read this before starting any analysis
- Quantitative Reasoning + Basic Concepts — consult as needed when questions arise about the why behind methods
R Basics
This section is required knowledge for all other LADAL tutorials.
R is the programming language used throughout LADAL. The skills here are assumed in Statistics, Data Visualization, Text Analytics, and all other sections. We strongly recommend completing these tutorials in order before moving on.
Why R?
Not sure why to invest in R? Our Why R? page explains our reasoning. The short answer: R is free, open-source, the industry standard for data science, has unmatched text analysis capabilities, and produces fully reproducible research workflows.
Tutorials
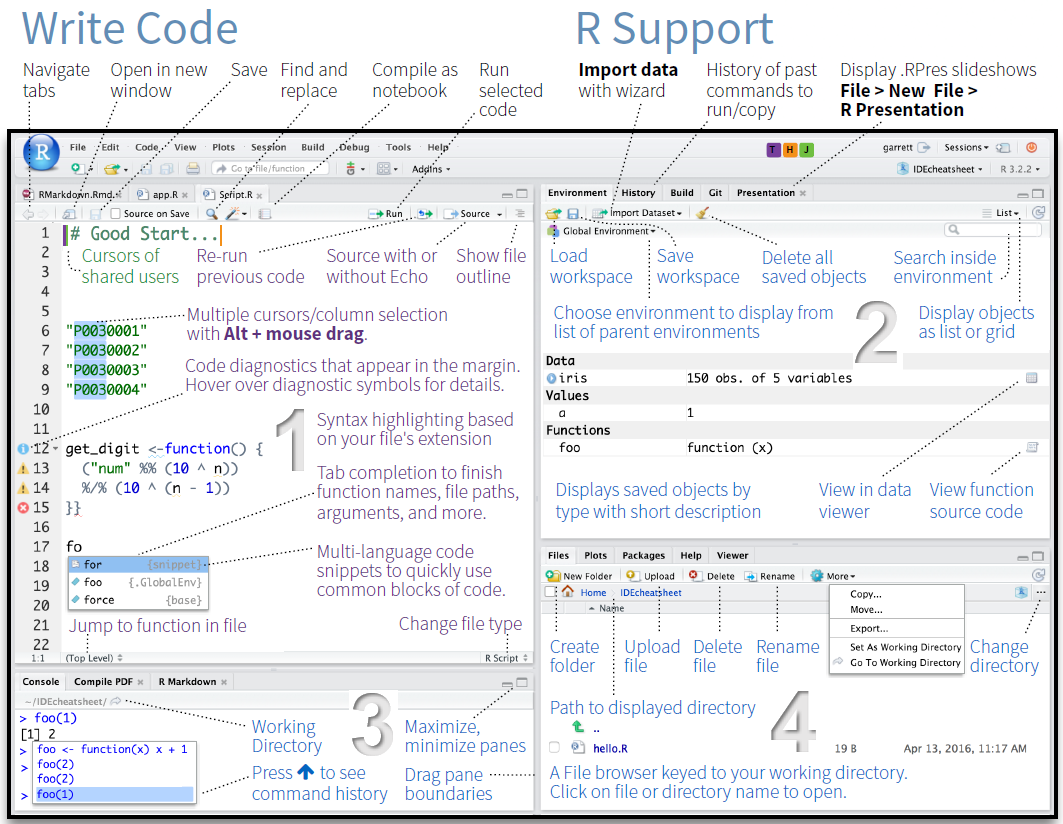
1. Getting Started with R
Installing R and RStudio; the RStudio interface; basic R syntax, variables, and functions; your first R script. This is the foundation for everything else at LADAL.
Time: ~2–3 hours · Prerequisites: None · Difficulty: ⭐ Beginner
2. Loading and Saving Data
Reading different file formats (CSV, Excel, TXT); importing data from URLs; saving data in various formats; working with file paths; handling import issues.
Time: ~1.5 hours · Prerequisites: Getting Started with R · Difficulty: ⭐ Beginner
3. String Processing
Manipulating text data; string operations (concatenate, split, replace); working with the stringr package; text cleaning techniques. Essential for text analysis and data cleaning.
Time: ~2 hours · Prerequisites: Getting Started with R · Difficulty: ⭐ Beginner
4. Regular Expressions
Pattern matching basics; regular expression syntax; finding and replacing patterns; advanced text search. A powerful tool for sophisticated text processing.
Time: ~2–3 hours · Prerequisites: String Processing · Difficulty: ⭐⭐ Intermediate
5. Handling Tables in R
Creating and manipulating data frames; subsetting and filtering; reshaping (wide vs. long format); merging and joining tables; tabulating data.
Time: ~2 hours · Prerequisites: Getting Started with R · Difficulty: ⭐ Beginner
6. Working with R: Control Flow, Functions, and Programming
Conditional logic (if/else, ifelse(), case_when()); for and while loops; writing reusable functions; the apply family; functional programming with purrr::map(); error handling with tryCatch(). These are the tools that turn R from a calculator into a scripting environment.
Time: ~3–4 hours · Prerequisites: Getting Started with R, Loading Data, Handling Tables · Difficulty: ⭐–⭐⭐ Beginner to Intermediate
7. Reproducibility with R
R Markdown basics; creating reproducible reports; version control with Git; R Projects for organisation; documenting your code. Professional research requires reproducibility.
Time: ~2–3 hours · Prerequisites: All previous R Basics tutorials · Difficulty: ⭐⭐ Intermediate
How-To Guides
These practical guides extend your R workflow into document creation and interactive publishing. They build on Reproducibility with R.
How-To: Creating R Notebooks with R Markdown and Quarto
Create reproducible analysis documents using R Markdown and Quarto: YAML headers, code chunks, Markdown syntax, output formats, cross-references, citations, and parameterised reports.
Time: ~2–3 hours · Prerequisites: Reproducibility with R · Difficulty: ⭐⭐ Intermediate
How-To: Publishing with Bookdown and Quarto
Publish free online books and websites from GitHub using bookdown and Quarto: step-by-step setup, GitHub Pages configuration, theme customisation, and troubleshooting.
Time: ~2–3 hours · Prerequisites: R Notebooks tutorial · Difficulty: ⭐⭐ Intermediate
How-To: Creating Interactive Jupyter Notebooks
Convert R Markdown analyses to interactive Jupyter notebooks launchable from GitHub via Binder; Google Colab as an alternative; best practices for notebook design.
Time: ~2 hours · Prerequisites: R Notebooks tutorial · Difficulty: ⭐⭐ Intermediate
Week 1: Why R? · Getting Started · Loading and Saving Data
Week 2: String Processing · Handling Tables
Week 3: Regular Expressions · Control Flow, Functions, and Programming
Week 4: Reproducibility with R · R Notebooks · Publishing (as needed)
Complete all exercises in each tutorial before moving on.
Data Collection and Acquisition
What you will learn: How to compile a corpus from scratch; how to collect, download, scrape, and simulate data in R — getting your raw material before analysis begins
Prerequisites: R Basics (Getting Started with R, Loading and Saving Data, String Processing)
Typical time: 10–18 hours total
Why this section exists: Data collection is the first step of any empirical project, yet guidance on it is often scattered. This section gathers all the main routes for acquiring data: compiling a corpus from scratch, loading from local files, downloading from archives, web scraping, generating synthetic data, and extracting text from PDFs.
| Your situation | Tutorial |
|---|---|
| Building a corpus from scratch | Compiling a Corpus |
| Files on your computer (CSV, Excel, TXT) | Loading and Saving Data |
| Public-domain books and literature | Downloading from Project Gutenberg |
| Websites and online text | Web Scraping with R |
| No real data yet (teaching, method testing) | Simulating Data with R |
| PDF documents | Converting PDFs to Text |
Tutorials
1. Compiling a Corpus
The principles and practice of building a corpus from scratch: the five core principles of corpus data collection (purpose-driven collection, representativeness, comparability, ethics, documentation); selecting and collecting written, spoken, web, learner, historical, and multilingual data; converting PDFs and Word documents to plain text in R; text cleaning with stringr; corpus folder structure and README/LICENSE conventions; organising metadata; corpus annotation types; quality control; ethical and legal frameworks including GDPR and the Australian Privacy Act; and planning a corpus project from research question to analysis-ready data.
Time: ~6–8 hours · Prerequisites: R Basics, String Processing, Regular Expressions · Difficulty: ⭐⭐ Intermediate
How-To Guides
How-To: Downloading Texts from Project Gutenberg
Download and clean public-domain literary texts from the Project Gutenberg archive using R’s gutenbergr package. Ideal for building literary corpora, teaching, and accessing ~60,000 freely available texts.
Time: ~1 hour · Prerequisites: Loading and Saving Data · Difficulty: ⭐ Beginner
How-To: Web Scraping with R
Collect text and data from websites programmatically using rvest and xml2; navigating HTML structure; handling pagination; respecting robots.txt; storing scraped data cleanly.
Time: ~2–3 hours · Prerequisites: Loading and Saving Data, String Processing · Difficulty: ⭐⭐ Intermediate
How-To: Simulating Data with R
Generate synthetic datasets for method development, teaching, and power analysis: sampling from distributions, creating controlled experimental designs, and building reproducible simulation pipelines.
Time: ~1.5 hours · Prerequisites: Getting Started with R · Difficulty: ⭐ Beginner
How-To: Converting PDFs to Text
Extract text from PDF files using pdftools; optical character recognition (OCR) for scanned documents; batch processing; saving output to text files. Essential when your data source is PDFs.
Time: ~1.5 hours · Prerequisites: Loading and Saving Data · Difficulty: ⭐ Beginner
Data Visualization
What you will learn: Creating professional, publication-quality visualisations in R
Prerequisites: R Basics (especially Getting Started with R and Handling Tables)
Typical time: 15–23 hours total
Key skill: Master ggplot2, R’s powerful visualisation framework, and learn when to choose which plot type
Effective visualisation is crucial for understanding your data and communicating findings. These tutorials teach principles of good design alongside technical implementation.
Tutorials
1. Introduction to Data Visualization
Principles of effective visualisation; introduction to ggplot2; creating basic plots (scatter, bar, line, box); customising colours, labels, and themes; saving publication-quality figures.
Time: ~3–4 hours · Prerequisites: R Basics · Difficulty: ⭐ Beginner
2. Mastering Data Visualization with R
Advanced plot types; faceting and small multiples; complex data transformations for visualisation; combining multiple plots; creating interactive visualisations.
Time: ~3–4 hours · Prerequisites: Introduction to Data Visualization · Difficulty: ⭐⭐ Intermediate–Advanced
3. Interactive Visualizations in R
Interactive scatter plots, line charts, bar charts, bubble charts, and histograms with plotly; converting static ggplot2 graphics to interactive HTML widgets with ggplotly(); animated graphics that transition through time using gganimate; animated bubble plots with plotly; interactive maps with zoom, pan, markers, popups, and choropleth polygon layers using leaflet; interactive searchable and sortable data tables with DT; embedding interactive visualisations in Quarto and R Markdown documents.
Time: ~4–5 hours · Prerequisites: Introduction to Data Visualization, Mastering Data Visualization with R · Difficulty: ⭐⭐ Intermediate
4. Conceptual Maps
What conceptual maps are and how spring-layout algorithms work; building semantic similarity matrices from co-occurrence (PPMI), TF-IDF, and GloVe embeddings; drawing publication-quality maps with igraph, ggraph, and qgraph; community detection (Louvain) and centrality overlays; vocabulary selection and edge thresholding.
Time: ~3–4 hours · Prerequisites: Introduction to Data Visualization; Introduction to Text Analysis helpful · Special focus: Corpus linguistics, cognitive linguistics, digital humanities, semantic analysis · Difficulty: ⭐⭐ Intermediate
Showcase Tutorials
These tutorials demonstrate complete, publication-ready visualisation workflows for specific data types and research contexts.
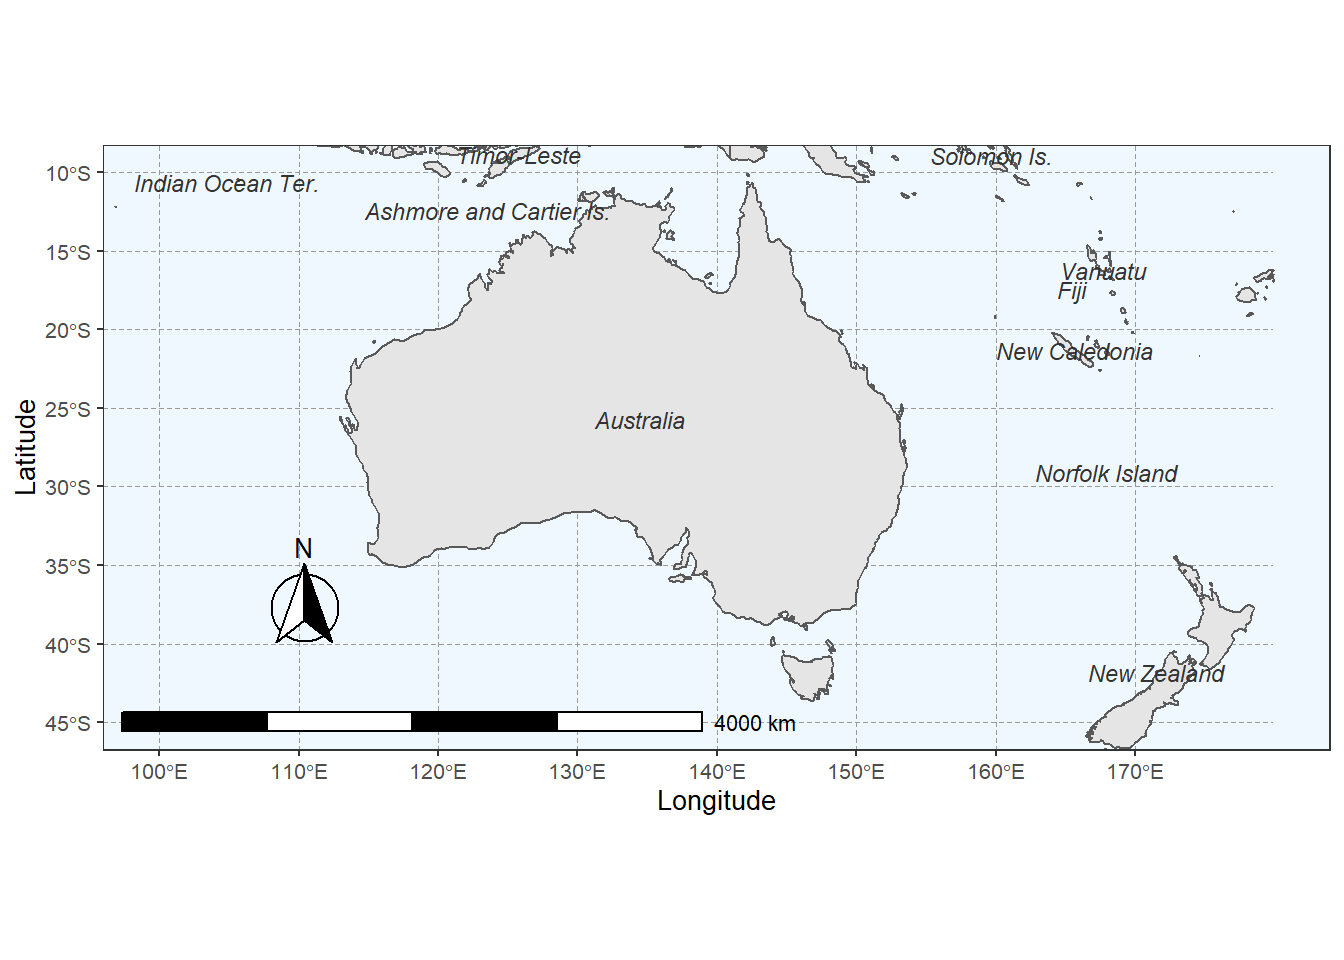
Showcase: Creating Typological Maps
Interactive map creation with leaflet; plotting geographical data; adding markers and popups; customising map appearance; publishing interactive maps.
Time: ~2 hours · Prerequisites: Introduction to Data Visualization · Special focus: Linguistic typology, dialectology, sociolinguistics
Showcase: Comparing Methods for Conceptual Maps
A method comparison showcase using the COOEE corpus of Australian historical letters: training a word2vec semantic space with wordVectors; building and visualising the same semantic network with six different layout algorithms — t-SNE (interactive via plotly), igraph Fruchterman-Reingold, igraph DRL, ForceAtlas2, UMAP, and textplot GML import. Discusses the strengths and weaknesses of each method for capturing local vs. global semantic structure. By Gerold Schneider
Time: ~4–5 hours · Prerequisites: Data Visualization, Word Embeddings, Network Analysis · Special focus: Corpus linguistics, computational semantics, digital humanities · Difficulty: ⭐⭐⭐ Advanced
Showcase: Creating Vowel Charts in R
Extract vowel formants from Praat; process acoustic data in R; create and customise vowel plots; compare speakers and varieties. A complete workflow from acoustic measurement to publication-ready figure.
Time: ~3 hours · Prerequisites: R Basics, Data Visualization, Praat · Special focus: Phonetics, sociolinguistics
- What am I trying to communicate?
- Who is my audience?
- What plot type best represents this data?
- Is my design accessible (colourblind-friendly)?
- Are my axes clearly labelled with units?
A misleading visualisation is worse than no visualisation.
Statistics
What you will learn: Statistical methods from descriptive summaries to advanced modelling
Prerequisites: R Basics; Data Visualization recommended
Typical time: 30–42 hours (depending on which tutorials you need)
Flexibility: After completing the two core foundation tutorials, all others can be taken in any order based on your research needs
Core Foundations
1. Descriptive Statistics
Measures of central tendency (mean, median, mode); dispersion (variance, standard deviation); summary statistics; exploring distributions; identifying outliers. Always describe your data before analysing it.
Time: ~2 hours · Prerequisites: R Basics · Difficulty: ⭐ Beginner
2. Basic Inferential Statistics
Null hypothesis testing; t-tests (one-sample, two-sample, paired); chi-square tests; correlation; interpreting p-values; avoiding common pitfalls.
Time: ~3 hours · Prerequisites: Descriptive Statistics · Difficulty: ⭐ Beginner
ANOVA, Regression, and Modelling
3. ANOVA, MANOVA & ANCOVA
The logic of ANOVA (partitioning variance, the F-ratio); one-way ANOVA with post-hoc tests (Tukey HSD, emmeans); two-way factorial ANOVA (main effects and interactions); repeated measures ANOVA and the sphericity assumption; MANOVA for multiple dependent variables (Pillai’s trace); ANCOVA (controlling for covariates); effect sizes: η², partial η², ω², Cohen’s f.
Time: ~4–5 hours · Prerequisites: Basic Inferential Statistics · Difficulty: ⭐–⭐⭐ Beginner to Intermediate
4. Regression Concepts
What regression is and when to use it; the logic of ordinary least squares (OLS); key assumptions of linear regression; understanding and interpreting coefficients; model fit, R², and residuals; principles of model selection; avoiding common conceptual pitfalls.
Time: ~3 hours · Prerequisites: Basic Inferential Statistics · Difficulty: ⭐–⭐⭐ Beginner to Intermediate
5. Regression Analysis in R
Fitting simple and multiple linear regression with lm(); binary and multinomial logistic regression; ordinal regression; model diagnostics and assumption checking; visualising regression results; reporting models.
Time: ~4–5 hours · Prerequisites: Regression Concepts · Difficulty: ⭐⭐ Intermediate
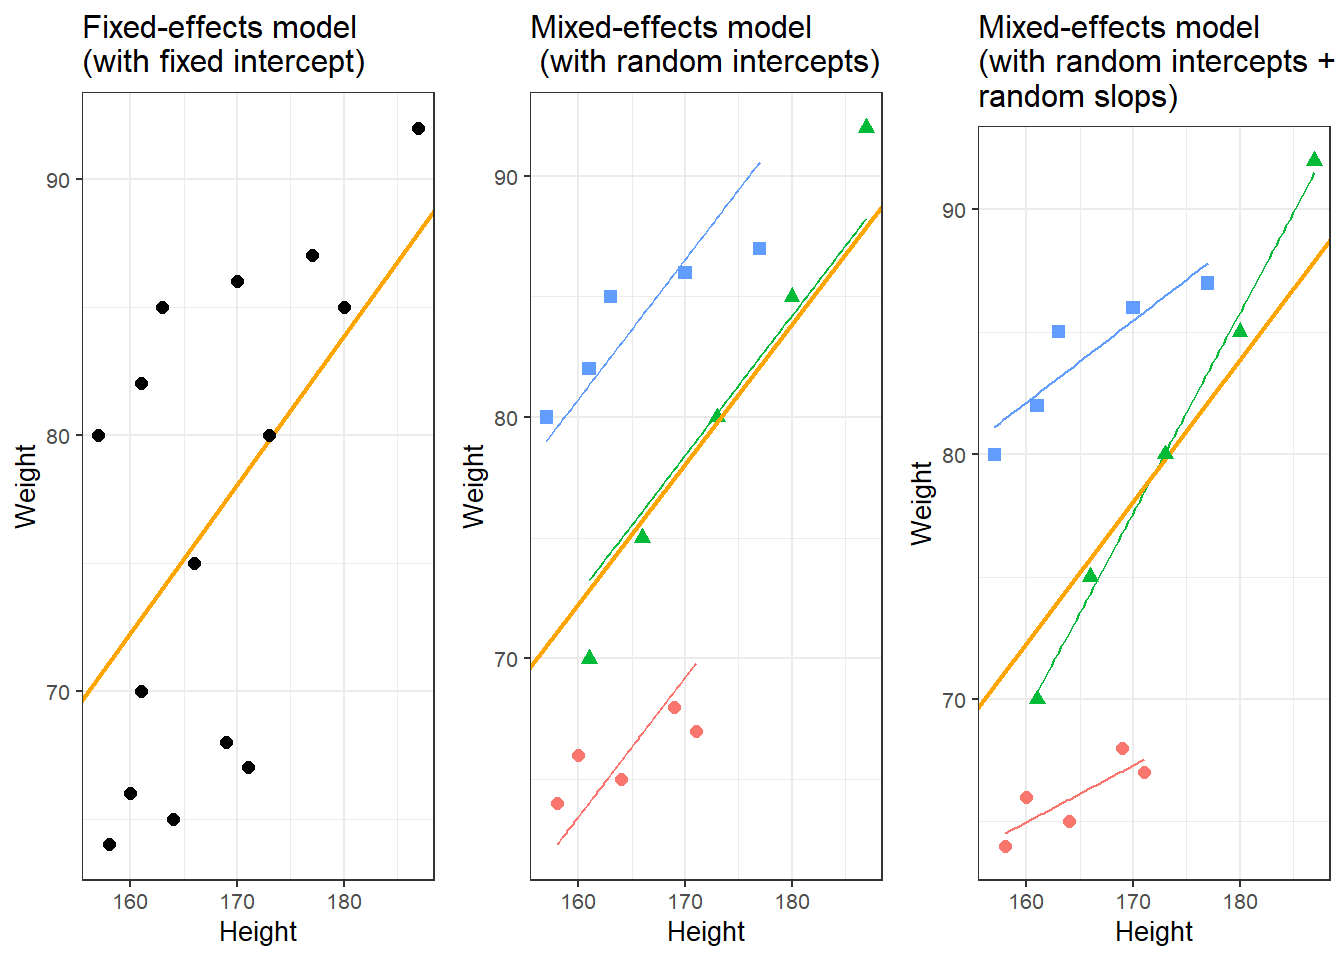
6. Mixed-Effects Models
Why hierarchical data require mixed-effects models (including the Simpson’s Paradox problem); random intercepts vs. random slopes; nested vs. crossed random effects; manual contrast coding; fitting with lme4 and nlme; diagnostics with the performance package; linear, logistic, Poisson, ordinal, and multinomial mixed-effects models; marginal and conditional R² via MuMIn; complete reporting templates.
Time: ~6–8 hours · Prerequisites: Regression Analysis in R · Difficulty: ⭐⭐⭐ Advanced
7. Structural Equation Modelling
When and why to use SEM; path diagrams (latent and observed variables); model specification with lavaan; confirmatory factor analysis (CFA); fitting and interpreting structural path models; global fit indices (CFI, RMSEA, SRMR, χ²); comparing models with AIC/BIC and modification indices; reproducible reporting.
Time: ~5–6 hours · Prerequisites: Regression Analysis in R; Dimension Reduction Methods helpful · Difficulty: ⭐⭐⭐ Advanced
Machine Learning and Classification
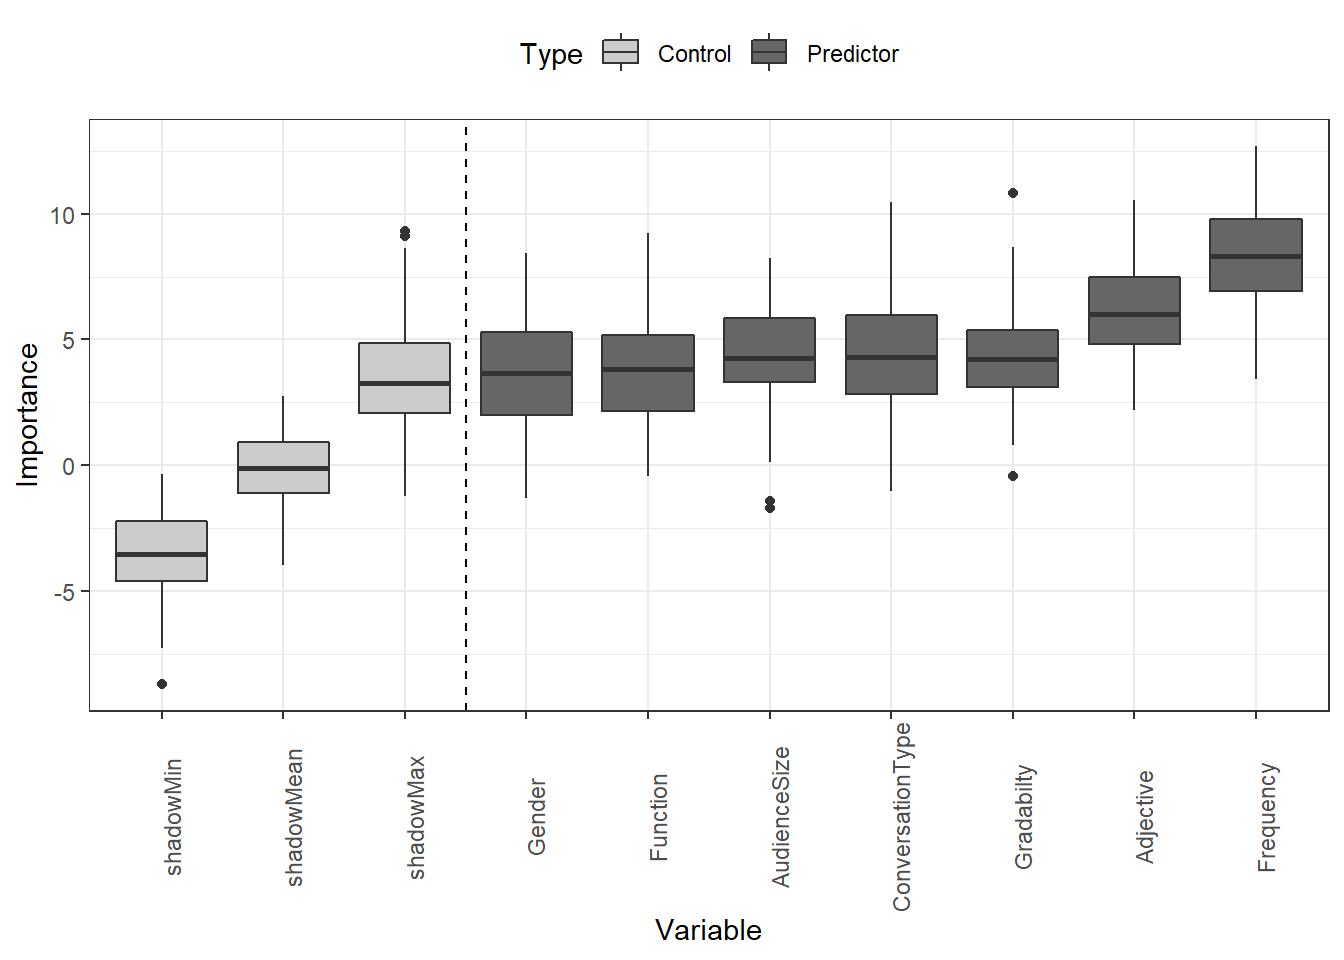
8. Tree-Based Models
Decision trees; random forests; variable importance; classification and regression trees (CART); ensemble methods; model interpretation. Powerful for both prediction and interpretability.
Time: ~4 hours · Prerequisites: Basic Inferential Statistics · Difficulty: ⭐⭐ Intermediate
9. Cluster and Correspondence Analysis
Hierarchical clustering; k-means clustering; correspondence analysis; determining optimal cluster numbers; visualising clusters; interpreting results. Discover patterns in unlabelled data.
Time: ~3–4 hours · Prerequisites: Descriptive Statistics · Difficulty: ⭐⭐ Intermediate
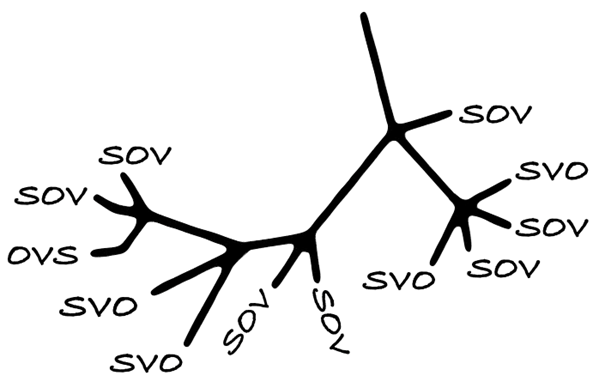
Showcase: Practical Phylogenetic Methods for Linguistic Typology
Genealogically-sensitive proportions and averages using the ACL and BM methods; constructing and manipulating linguistic trees with glottoTrees; assigning branch lengths; combining glottolog family trees into supertrees; a complete worked example reproducing Yin (2020) on sonority sequencing in 496 languages. Essential for quantitative typology and historical linguistics.
Time: ~5–6 hours · Prerequisites: Cluster Analysis, basic statistics · Difficulty: ⭐⭐⭐ Advanced · By Erich Round & Martin Schweinberger
Showcase: Reinforcement Learning and Text Summarisation
Can reinforcement learning improve text summarisation? Reinforcement learning basics; applying RL to NLP; text summarisation with RL; evaluation methods. A complete case study in advanced NLP.
Time: ~6–7 hours · Prerequisites: R Basics, Text Analytics, basic ML knowledge · Difficulty: ⭐⭐⭐ Advanced
Semantic and Similarity Analysis
10. Introduction to Lexical Similarity
Measuring text similarity; string distance metrics; edit distance; comparing documents; applications in linguistics. Foundational for text comparison tasks.
Time: ~2–3 hours · Prerequisites: R Basics, String Processing · Difficulty: ⭐⭐ Intermediate
11. Semantic Vector Space Models
Vector space models; distributional semantics; word similarity measures; semantic clustering; applications in NLP. A computational approach to meaning.
Time: ~4–5 hours · Prerequisites: Basic Inferential Statistics; some linear algebra helpful · Difficulty: ⭐⭐⭐ Advanced
Advanced Methods
12. Dimension Reduction Methods
Principal Component Analysis (PCA); Factor Analysis; Multidimensional Scaling (MDS); when to use each method; interpreting components and factors; visualisation techniques.
Time: ~4 hours · Prerequisites: Basic Inferential Statistics, correlation · Difficulty: ⭐⭐⭐ Advanced
13. Power Analysis
Determining sample size; power calculations; effect size estimation; planning studies; post-hoc power analysis. Design adequately powered studies before you collect data.
Time: ~2–3 hours · Prerequisites: Basic Inferential Statistics · Difficulty: ⭐⭐ Intermediate
Showcase: Designing and Analyzing Survey and Questionnaire Data
Design and analyze survey and questionnaire data in R — Likert scales, reliability analysis, factor analysis, ordinal regression, and reproducible workflows for linguistics and social science research: a complete workflow from survey design to publication-ready output.
Time: ~4 hours · Prerequisites: R Basics, Data Visualization, Basic Statistics · Special focus: Survey research, applied linguistics, social science
Showcase: Eye-Tracking Data Analysis in R
Research question: How can eye-tracking data be prepared, processed, and analysed to study visual attention and reading behaviour? A complete workflow covering data import and quality control; preprocessing raw gaze samples into fixations and saccades using event detection algorithms; defining and coding Areas of Interest (AOIs); computing key dependent measures (first fixation duration, total dwell time, fixation count, gaze path); visualising scan paths and fixation heatmaps; and fitting linear mixed-effects models to test hypotheses about reading time and attention allocation. Applicable to reading research, psycholinguistics, usability studies, and any domain using visual attention as a behavioural measure.
Time: ~5–6 hours · Prerequisites: R Basics, Basic Inferential Statistics, Mixed-Effects Models recommended · Special focus: Psycholinguistics, reading research, experimental linguistics, cognitive science · Difficulty: ⭐⭐⭐ Advanced
Experimental research (psycholinguistics, SLA): Descriptive → Basic Inferential → ANOVA → Regression Concepts → Regression → Mixed-Effects Models → SEM → Power Analysis → Showcase: Eye-Tracking Data Analysis
Corpus linguistics: Descriptive → Basic Inferential → Regression Concepts → Regression → Cluster & Correspondence Analysis → Dimension Reduction
Sociolinguistics: Descriptive → Basic Inferential → ANOVA → Regression → Mixed-Effects Models → SEM → Correspondence Analysis → Survey Showcase
Computational linguistics / NLP: Basic Inferential → Tree-Based Models → Semantic Vector Space Models → Dimension Reduction → Cluster Analysis
Applied linguistics / SLA: Descriptive → Basic Inferential → Regression Concepts → Regression → Mixed-Effects Models → SEM → Power Analysis → Survey Showcase
Text Analytics
What you will learn: Computational methods for analysing text data — from basic concordancing to advanced NLP
Prerequisites: R Basics required; String Processing and Regular Expressions highly recommended
Typical time: 58–78 hours for all tutorials and showcases
Flexibility: After completing the two introductory tutorials, jump to any specific topic that matches your research
Foundations
1. Introduction to Text Analysis: Concepts
What is text analytics? Key concepts and terminology; text as data; overview of methods; common applications; research design considerations. The conceptual foundation for all text analysis.
Time: ~2 hours · Prerequisites: None · Difficulty: ⭐ Beginner
2. Introduction to Text Analysis: Practical Overview
Concordancing basics; word frequency analysis; collocations; keywords; text classification; POS tagging; named entity recognition; dependency parsing. Hands-on introduction to the core methods.
Time: ~4–5 hours · Prerequisites: R Basics · Difficulty: ⭐ Beginner
Core Methods
3. Finding Words in Text: Concordancing
Creating KWIC (keyword-in-context) displays; simple and complex search patterns; using regular expressions; filtering and sorting concordances; analysing context; exporting results. The foundation of corpus linguistics.
Time: ~3 hours · Prerequisites: R Basics, String Processing · Difficulty: ⭐ Beginner
4. Collocation and N-gram Analysis
Identifying collocations; measuring collocation strength; N-gram extraction; visualising semantic links; statistical significance testing; applications in phraseology. Uncover word associations and phraseological patterns.
Time: ~3–4 hours · Prerequisites: Concordancing, Basic Statistics · Difficulty: ⭐⭐ Intermediate
5. Keyness and Keyword Analysis
Calculating keyness; identifying distinctive vocabulary; comparing corpora; statistical measures of keyness; visualising keywords; interpreting results. Find what makes a text or corpus distinctive.
Time: ~3 hours · Prerequisites: Basic Inferential Statistics · Difficulty: ⭐⭐ Intermediate
6. Tagging and Parsing
Part-of-speech tagging; dependency parsing; using udpipe; extracting grammatical patterns; annotating corpora. Essential for grammatical and syntactic analysis of text.
Time: ~3–4 hours · Prerequisites: Basic linguistics knowledge helpful · Difficulty: ⭐⭐ Intermediate
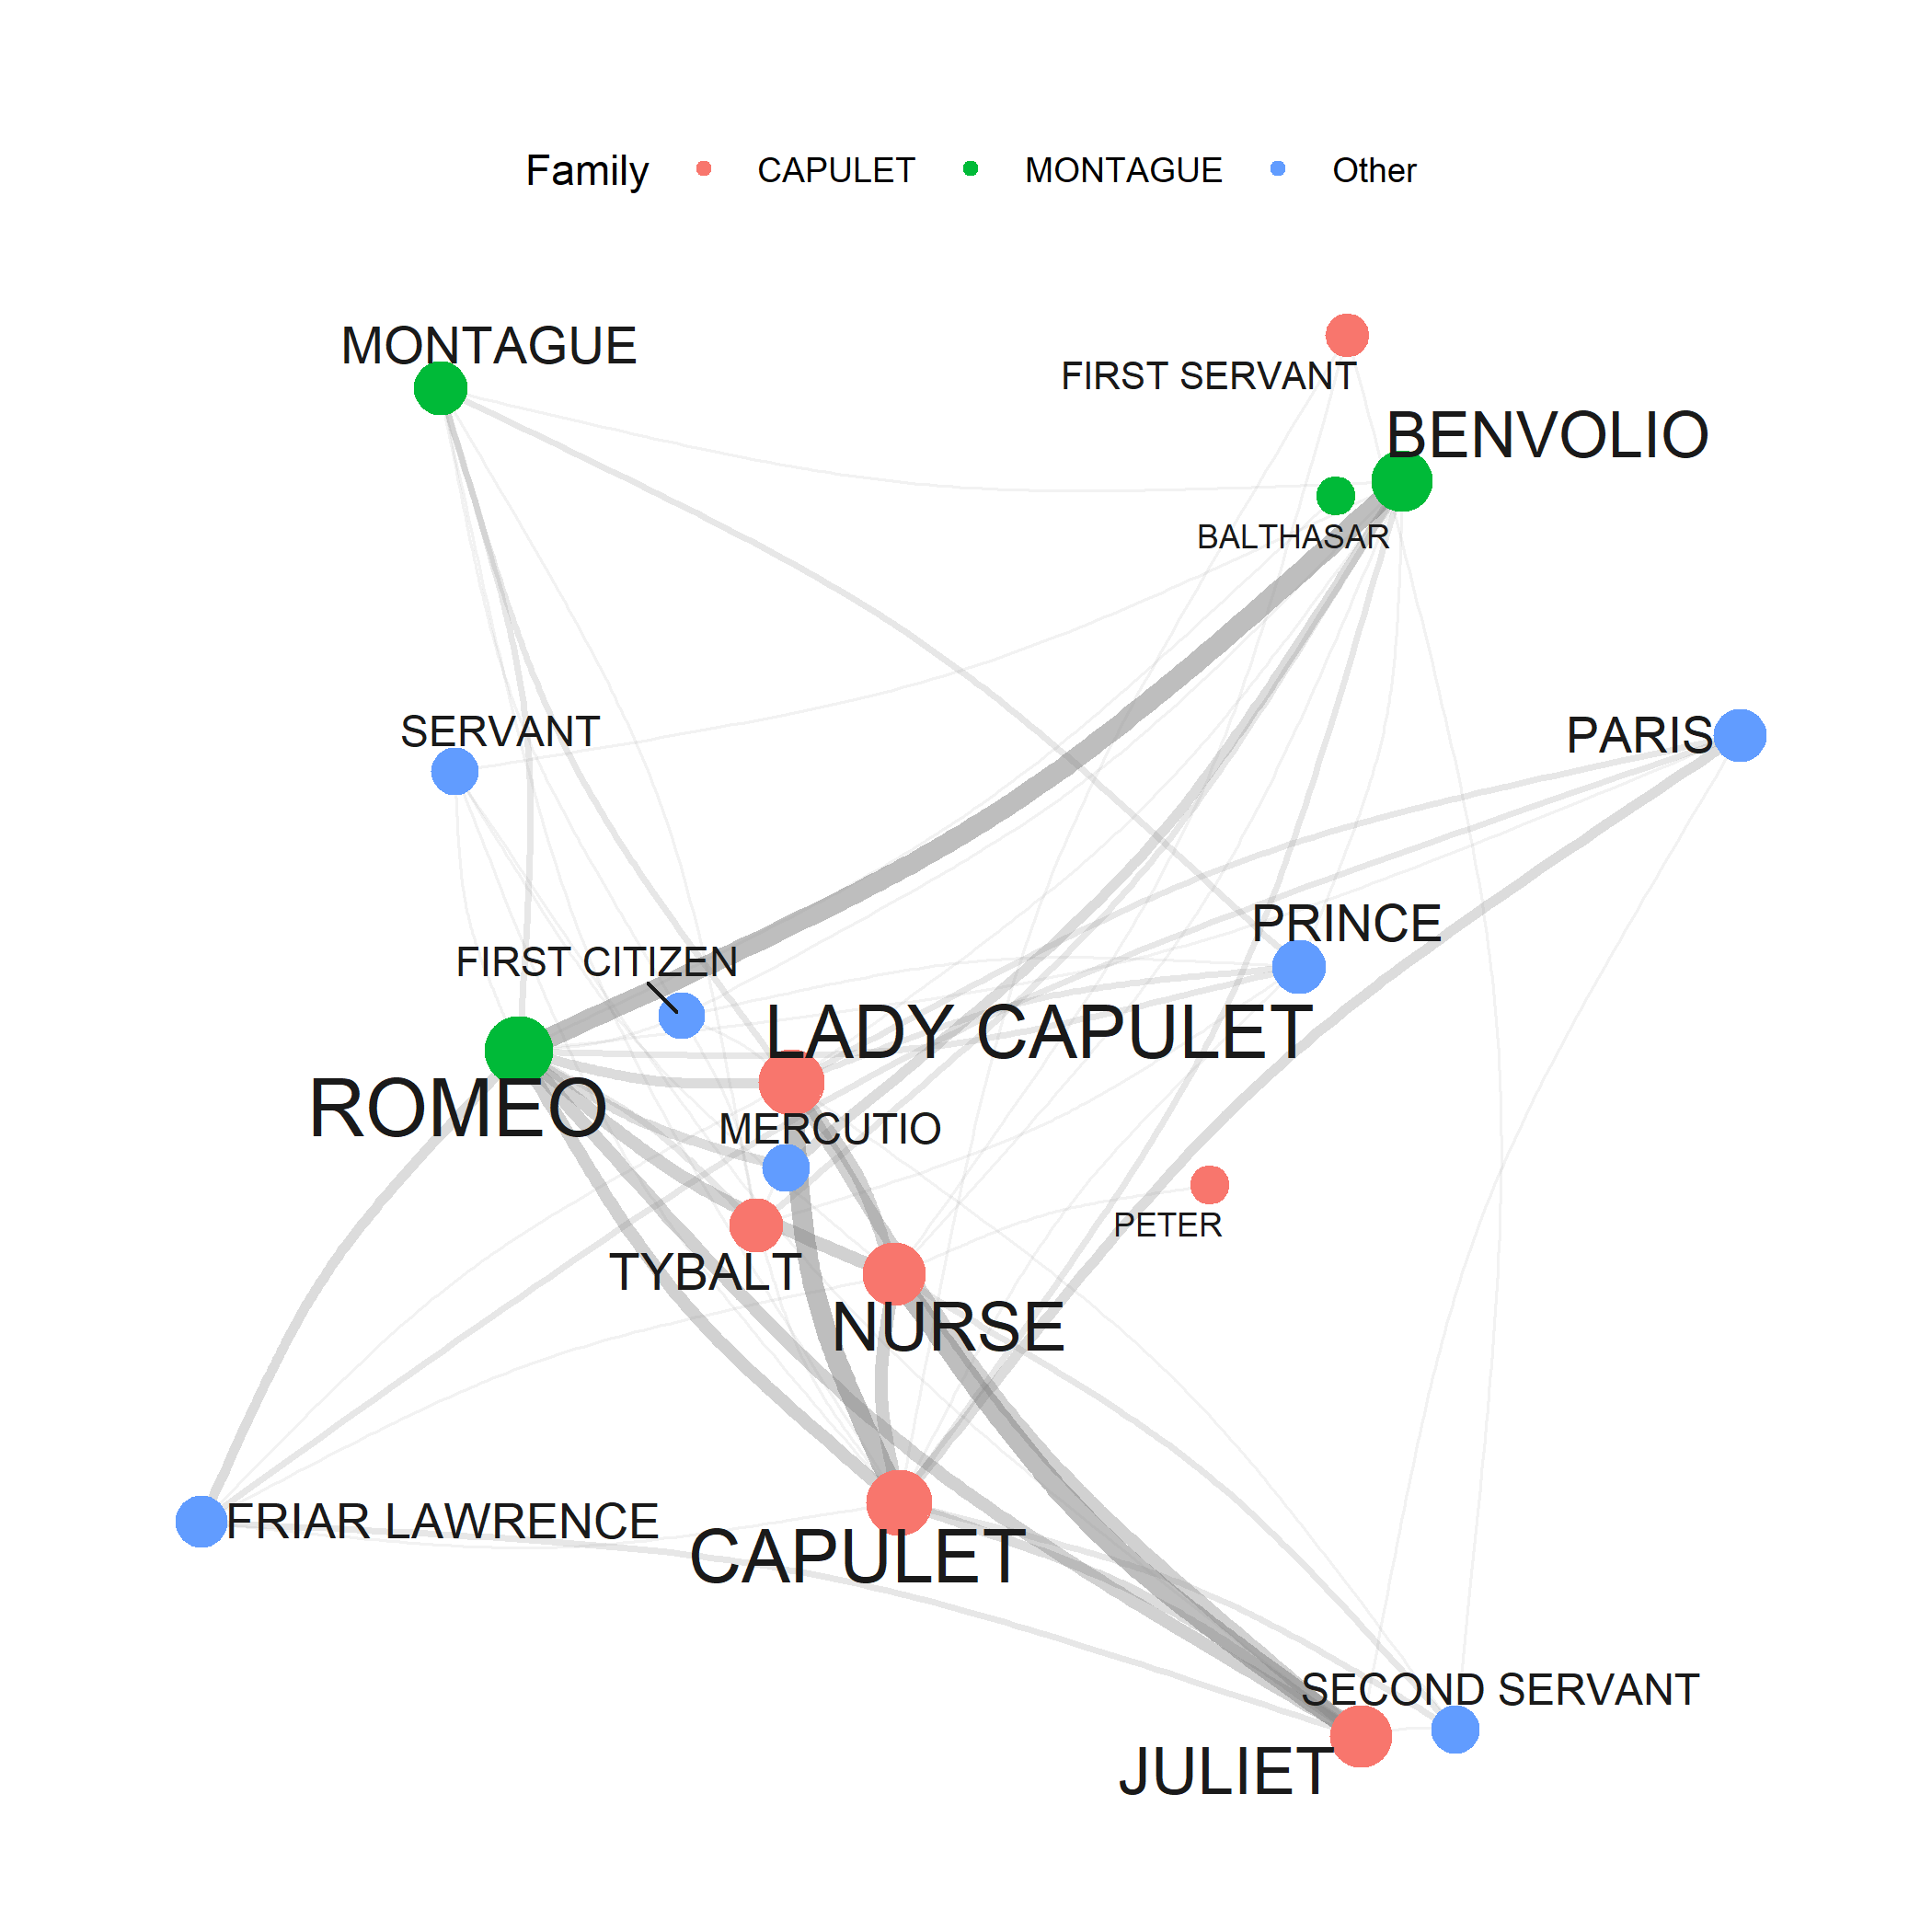
7. Network Analysis
Creating network graphs; visualising relationships; network metrics; community detection; applications to text data; interactive networks. A powerful visualisation framework for any relational data.
Time: ~3–4 hours · Prerequisites: Basic R, Data Visualization helpful · Difficulty: ⭐⭐ Intermediate
Advanced NLP Methods
8. Topic Modelling
Latent Dirichlet Allocation (LDA); determining optimal topic numbers; interpreting topics; visualising topic models; human-supervised seeded modelling; applications and limitations. Discover hidden themes in large text collections.
Time: ~4–5 hours · Prerequisites: Basic Statistics · Difficulty: ⭐⭐ Intermediate
9. Sentiment Analysis
Sentiment lexicons; calculating sentiment scores; sentiment over time; domain-specific sentiment; limitations and cautions. Quantify emotional tone in text data.
Time: ~3 hours · Prerequisites: Basic text processing · Difficulty: ⭐⭐ Intermediate
10. Automated Text Summarisation
Extractive summarisation; sentence scoring methods; TextRank algorithm; creating automatic summaries; evaluation methods. Condense large text collections automatically.
Time: ~2–3 hours · Prerequisites: Basic text processing · Difficulty: ⭐⭐ Intermediate
11. Spell Checking with R
Implementing spell checkers; handling OCR errors; custom dictionaries; suggesting corrections; batch processing. Essential for cleaning text data, especially from digitised sources.
Time: ~2 hours · Prerequisites: String Processing · Difficulty: ⭐ Beginner
12. Readability Analysis with R
Computing readability metrics (Flesch, Gunning Fog, SMOG, Coleman-Liau, Dale-Chall); using quanteda.textstats and koRpus; comparing text complexity across genres; analysing learner vs native-speaker writing. Useful for quantifying linguistic complexity in research and digital humanities.
Time: ~2 hours · Prerequisites: String Processing · Difficulty: ⭐⭐ Intermediate
Embeddings and Neural Language Models
13. Word Embeddings and Vector Semantics
What are word embeddings? Training word2vec models; using pre-trained embeddings (GloVe, fastText); finding similar words; word analogies; visualising embeddings; research applications (semantic change, bias detection). State-of-the-art approach to computational semantics.
Time: ~5–6 hours · Prerequisites: Basic Statistics; some linear algebra helpful · Difficulty: ⭐⭐⭐ Advanced
14. BERT and RoBERTa in R: Transformer-Based NLP
How BERT and RoBERTa work (self-attention, WordPiece tokenisation, pre-training, transfer learning); why pure-R transformer inference requires Python via reticulate; environment setup; extracting contextualised sentence embeddings; sentiment and topic classification with RoBERTa; named entity recognition; extractive question answering; fine-tuning RoBERTa on custom labelled data; side-by-side comparison of DistilBERT, BERT-base, and RoBERTa-base across speed, size, and performance.
Time: ~5–6 hours · Prerequisites: R Basics, Word Embeddings, String Processing; Python installation required · Difficulty: ⭐⭐⭐ Advanced
Unlike other LADAL tutorials, this tutorial requires Python to be installed alongside R. All code is displayed but not executed during knitting. Work through the tutorial interactively in RStudio, completing the setup steps in Section 4 first.
15. Deep Learning with R: Recurrent Neural Networks and TensorFlow
Core concepts of deep learning: neurons, layers, activation functions, and backpropagation; the architecture of Recurrent Neural Networks (RNNs) and their capacity to model sequential data; Long Short-Term Memory (LSTM) networks and how gating mechanisms solve the vanishing gradient problem; implementing RNNs and LSTMs in R using the Keras interface to TensorFlow; practical applications to language and text data including sequence classification, text generation, and sentiment analysis.
Time: ~5–6 hours · Prerequisites: R Basics, Word Embeddings, BERT & RoBERTa helpful; TensorFlow and Keras must be installed · Difficulty: ⭐⭐⭐ Advanced
This tutorial requires TensorFlow and the Keras R package to be installed. Run install.packages("keras") then keras::install_keras() to set up the Python backend automatically. A GPU is not required but will significantly speed up training on larger datasets.
Local Large Language Models
16. Local Large Language Models in R with Ollama
What Ollama is and why running LLMs locally matters (privacy, reproducibility, cost); installing Ollama and pulling models; the ollamar R package; basic text generation with generate(); multi-turn conversation with chat() and conversation history management; prompt-based sentiment analysis and text classification; named entity recognition; text summarisation; generating sentence embeddings with embed(); corpus-scale batch processing and parallelisation; using a local LLM as a privacy-preserving R coding assistant.
Time: ~4–5 hours · Prerequisites: R Basics, String Processing; Ollama application must be installed · Difficulty: ⭐⭐ Intermediate
Unlike other LADAL tutorials, this tutorial requires Ollama — a free application — to be installed on your machine before any code will run. Download it from ollama.com. No Python or GPU is required; the tutorial uses the llama3.2 3B model which runs on any laptop with 8 GB RAM.
17. Privacy-Preserving Analysis with Local LLMs
How can researchers use AI code assistants for sensitive data without violating ethics approvals? A complete five-step workflow: describing sensitive data structure to a local LLM; generating synthetic transcript and tabular proxy datasets that mirror real data without containing real participants; uploading the synthetic proxy to a cloud AI (Claude, ChatGPT) to obtain R analysis code; and running that code locally on the real data. Covers both conversation transcripts (CHAT notation) and clinical tabular data. The real data never leaves the researcher’s machine at any point.
Time: ~3–4 hours · Prerequisites: Local LLMs with Ollama · Special focus: Research ethics, clinical linguistics, sensitive data, data governance · Difficulty: ⭐⭐ Intermediate
Showcase Tutorials
These tutorials demonstrate complete research workflows — from research question to published results — using methods taught across LADAL sections.
Showcase: Classifying American Political Speeches
Research question: Can we automatically classify political speeches by party? Document classification workflow; feature extraction; machine learning for text; model evaluation; interpreting results.
Time: ~4 hours · Prerequisites: R Basics, Basic Statistics · Created by Gerold Schneider & Max Lauber for ATAP
Showcase: Topic Modelling of Charles Dickens’ Novels
Research question: Can topic modelling reveal Dickens’ social criticism and literary realism without reading the novels? Downloading a corpus from Project Gutenberg; POS tagging with udpipe to remove proper nouns; chunking into pseudo-documents; iterative Structural Topic Model (STM) fitting across seven models with varying chunk sizes, topic numbers, and frequency thresholds; interpreting topic keywords in relation to poverty, dialect speech, and literary realism. By Gerold Schneider, Max Lauber & Martin Schweinberger
Time: ~5–6 hours · Prerequisites: R Basics, Topic Modelling tutorial · Special focus: Literary studies, computational stylistics, digital humanities · Difficulty: ⭐⭐ Intermediate
Showcase: Corpus Linguistics with R
Research question: Complete corpus-based research scenarios. Frequency analysis; dispersion and distribution; comparative analysis; visualisation; multi-method corpus workflows.
Time: ~5–6 hours · Prerequisites: R Basics, Concordancing, Basic Statistics
Showcase: Analysing Learner Language
Research question: How does learner language differ from native speaker language? Learner corpus compilation; error analysis; comparing native and non-native data; statistical testing; pedagogical applications.
Time: ~4–5 hours · Prerequisites: R Basics, Statistics, Text Analytics · Special focus: SLA, language teaching
Showcase: Computational Literary Stylistics
Research question: Can we computationally analyse literary style? Stylometric analysis; authorship attribution; measuring style; comparing authors; visualising stylistic features.
Time: ~5–6 hours · Prerequisites: R Basics, Text Analytics, Statistics · Special focus: Digital humanities, literary studies
Showcase: Lexicography and Creating Dictionaries
Research question: How can we create dictionaries computationally? Dictionary creation principles; finding synonyms computationally; semantic similarity; entry generation; format and structure.
Time: ~3–4 hours · Prerequisites: R Basics, Text Analytics, Embeddings helpful
Corpus linguistics: Concepts → Practical Overview → Concordancing → Collocations → Keywords → Tagging & Parsing → Showcase: Corpus Linguistics with R
Computational linguistics: Practical Overview → Topic Modelling → Word Embeddings → Sentiment Analysis → Tagging & Parsing → BERT & RoBERTa → Local LLMs with Ollama → Network Analysis
Digital humanities: Concepts → Concordancing → Topic Modelling → Sentiment Analysis → Word Embeddings → Showcase: Literary Stylistics
Discourse analysis: Concordancing → Collocations → Keywords → Sentiment Analysis → Network Analysis
Historical linguistics: Concordancing → Collocations → Keywords → Word Embeddings (semantic change) → Network Analysis
Second language acquisition: Concepts → Practical Overview → Concordancing → Collocations → Keywords → Showcase: Learner Language
Privacy-sensitive research: Local LLMs with Ollama → Privacy-Preserving Analysis with Local LLMs
Deep learning for NLP: Word Embeddings → BERT & RoBERTa → Deep Learning with R (RNNs & LSTMs)
Getting Help and Support
Common Problems
Error: could not find function "..." → Load the package first: library(package_name) — and if it’s not installed yet: install.packages("package_name")
object '...' not found → Did you run the code that creates that object? In an R script, execute from the top. In a notebook, run all preceding cells.
there is no package called '...' → Install it: install.packages("package_name")
cannot open file '...': No such file or directory → Check your working directory with getwd(). Use relative paths. Consider here::here() for robust file references.
Code runs but gives unexpected results → Check for typos (R is case-sensitive). Print intermediate results to debug step by step. Verify your data loaded correctly with head() and str().
Additional Resources
R help: ?function_name in the R console; RStudio Help pane; RStudio Community; Stack Overflow (R tag)
Free online books: R for Data Science; Text Mining with R
Cheatsheets: RStudio Cheatsheets
Interactive practice: swirl
Contact LADAL: ladal@uq.edu.au — report errors, suggest tutorials, or ask questions
Tutorial Statistics
| Section | Core tutorials | Showcases & How-Tos | Est. hours |
|---|---|---|---|
| Data Science Basics | 5 | — | 5–8 |
| R Basics | 7 | 3 How-Tos | 14–20 |
| Data Collection & Acquisition | 1 | 4 How-Tos | 12–18 |
| Data Visualization | 4 | 3 Showcases | 17–27 |
| Statistics | 13 | 4 Showcases | 35–48 |
| Text Analytics | 17 | 6 Showcases | 65–86 |
| TOTAL | 47 | 21 | 148–212 |
What’s New
This page was written with the assistance of Claude (claude.ai), a large language model created by Anthropic. All content was reviewed and approved by Martin Schweinberger, who takes full responsibility for its accuracy.