Code
# Install required packages — run once
install.packages("devtools")
devtools::install_github("mkearney/rmd2jupyter")

This tutorial demonstrates how to create interactive Jupyter notebooks from R Markdown documents — an essential tool for combining code, output, and narrative in a single, dynamic, cloud-executable document. Interactive notebooks allow researchers, students, and collaborators to run and modify your analysis directly in a browser, without installing R or any packages locally.
The tutorial is aimed at researchers working with language data, especially those in the humanities and social sciences. It is particularly useful for beginner to intermediate R users who want to share their analyses as reproducible, executable documents — whether for teaching, collaborative review, or open science.
By the end of this tutorial you will be able to:
.Rmd file to a .ipynb notebook using the rmd2jupyter packageBefore working through this tutorial, you should be familiar with:
Martin Schweinberger. 2026. Creating Interactive Jupyter Notebooks. The Language Technology and Data Analysis Laboratory (LADAL), The University of Queensland, Australia. url: https://ladal.edu.au/tutorials/jupyter/jupyter.html (Version 3.1.1). doi: 10.5281/zenodo.19332892.
# Install required packages — run once
install.packages("devtools")
devtools::install_github("mkearney/rmd2jupyter")library(flextable)
klippy::klippy()What you will learn: What Jupyter notebooks are; why they matter for reproducible research; how they differ from static documents; and where they fit in the R-based research workflow
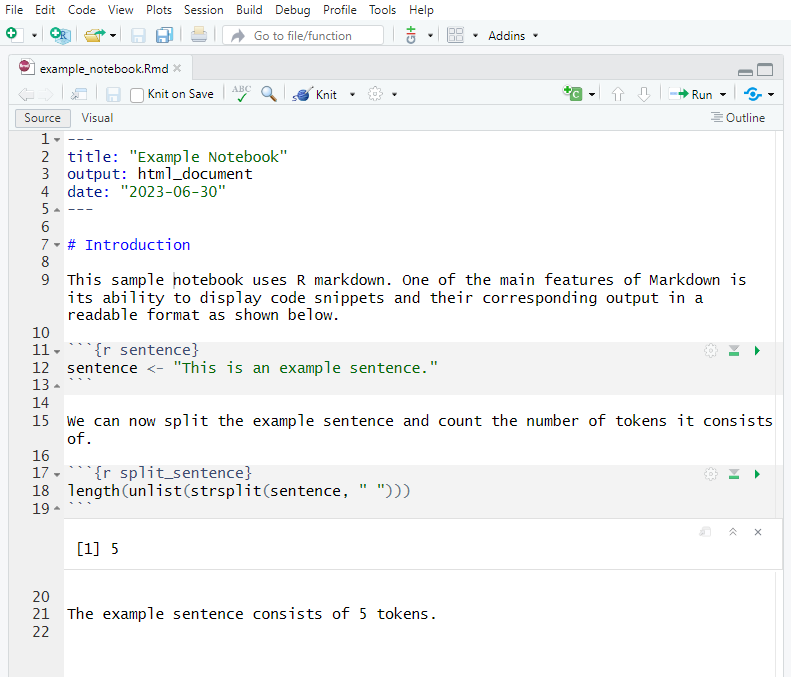
A Jupyter notebook (.ipynb) is a document format that interleaves three kinds of content in a single file:
Unlike a rendered R Markdown document (which produces a static HTML or PDF file where the code has already been run), a Jupyter notebook is live: a reader with access to a running kernel can execute any cell, modify the code, and immediately see updated output — all in a browser, with no local software installation required.
This makes Jupyter notebooks particularly powerful for:
Jupyter grew out of the IPython project and was officially launched in 2014. The name is a portmanteau of Julia, Python, and R — the three languages it was designed to support. Today it supports over 100 programming languages via interchangeable kernels.
The .ipynb format is a JSON file that stores cells, their outputs, and kernel metadata. Jupyter notebooks can be opened in:
.ipynb files as static previews directly in the browserLinguistics and language data research increasingly involves computational methods — corpus analysis, frequency profiling, collocational statistics, sentiment analysis, and machine learning. Sharing these analyses as interactive notebooks has several advantages over sharing static PDFs or R scripts:
What you will learn: How Jupyter notebooks compare to R Markdown documents and Quarto documents; when each format is appropriate; and how they can be used together
Feature | R Markdown (.Rmd) | Quarto (.qmd) | Jupyter (.ipynb) |
|---|---|---|---|
File format | Plain text | Plain text | JSON (binary-like for version control) |
Primary language | R (Python via `reticulate`) | R, Python, Julia, Observable | R, Python, Julia, 100+ kernels |
Execution model | Render all at once via `knitr` | Render all at once via `knitr`/`jupyter` | Cell-by-cell, interactive |
Output | Static HTML, PDF, Word | Static HTML, PDF, Word, RevealJS | Live interactive + static export |
Interactivity | None — output is fixed | None — output is fixed | Full — readers can run and edit cells |
Cloud execution | Via Binder (after conversion) | Via Binder (after conversion) | Yes — Binder, Google Colab, natively |
Version control | Excellent — plain text diffs cleanly | Excellent — plain text diffs cleanly | Harder — JSON diffs are noisy |
Inline prose | Markdown between chunks | Markdown between chunks | Markdown cells (separate from code) |
YAML header | Yes — controls output format | Yes — richer than R Markdown | No |
Cross-references | Via `bookdown` | Built-in | No built-in system |
PDF output | Yes — via LaTeX | Yes — via LaTeX | Via `nbconvert` |
Slides | Yes — ioslides, Slidy, Beamer | Yes — RevealJS, Beamer, PowerPoint | Via RISE extension |
Multi-format output | Yes — HTML, PDF, Word, slides | Yes — HTML, PDF, Word, slides, websites, books | Via `nbconvert`: HTML, PDF, script |
Collaboration | Shared repo; track-changes harder | Shared repo; track-changes harder | Real-time via JupyterHub; Colab |
Best for | Reports, papers, books, websites | Modern reports, websites, books | Interactive teaching, reproducible demos |
The most productive approach treats these formats as complementary tools in the same workflow. Develop your analysis in R Markdown or Quarto (clean version control, full output format flexibility), then convert the finished analysis to Jupyter for interactive sharing. The conversion is a one-way export step — you maintain the .Rmd/.qmd as the canonical source and derive the .ipynb from it.
What you will learn: The end-to-end workflow for creating and publishing an interactive notebook from an R Markdown source file; what infrastructure is involved; and what each step produces
The complete workflow has five stages:
Stage | Step | Tool | Output |
|---|---|---|---|
1 | Develop analysis | RStudio + R Markdown / Quarto | `.Rmd` or `.qmd` — the canonical source |
2 | Prepare notebook version | Text editor / RStudio | `_cb.Rmd` — cleaned version without YAML, with install script |
3 | Convert to Jupyter format | `rmd2jupyter` R package | `.ipynb` — the Jupyter notebook file |
4 | Set up Binder repository | GitHub + ATAP/LDaCA Binder template | GitHub repository with `install.R`, `.ipynb`, and data files |
5 | Share and launch | Binder (mybinder.org) | Public URL that launches a live Jupyter environment |
This workflow uses a Binder template maintained by the Australian Text Analytics Platform (ATAP) and the Language Data Commons of Australia (LDaCA). These are Australian national infrastructure projects that provide tools and platforms for computational text analysis in the humanities and social sciences. The Binder template pre-configures a Docker-based R environment so your notebook launches reliably in the cloud.
What you will learn: How to prepare your .Rmd source file for conversion; what to remove, what to add, and how to restructure the code for a notebook environment
A standard R Markdown document is designed for rendering to a static output — it has a YAML header that controls the output format, it may load packages silently, and it assumes that all code runs in sequence in a single non-interactive pass. A Jupyter notebook, by contrast, is designed for interactive cell-by-cell execution by a reader who may have no R experience. These different assumptions require some targeted adjustments before conversion.
Never modify your canonical .Rmd file directly. Instead, duplicate it and give the copy a name that signals it is the notebook version — the convention used by ATAP/LDaCA is the _cb suffix (for “code book”):
original:   my_analysis.Rmd
notebook:   my_analysis_cb.Rmd
All subsequent preparation steps happen on my_analysis_cb.Rmd. Your original file remains unchanged.
Jupyter notebooks do not use YAML headers. The YAML block at the top of your .Rmd file — everything between the --- delimiters — should be deleted entirely.
Before:
title: "Frequency Analysis of the BNC"
author: "Martin Schweinberger"
date: "2026-03-11"
output:
  html_document:
    toc: true
    theme: cosmo
After: — the YAML block is gone. Replace it with a first-level Markdown heading that becomes the notebook title:
# Frequency Analysis of the BNCIf you delete the YAML content but leave the --- delimiters behind, rmd2jupyter will produce a malformed notebook. Delete the delimiters as well.
In a standard .Rmd file, package installation is typically either absent (assuming the reader has already installed packages) or wrapped in eval=FALSE to prevent it from running during render. In a Jupyter notebook environment, package installation is handled differently — via a separate install.R file that Binder runs when building the Docker image.
Remove any install.packages() calls from your notebook file. If you need to show installation code for pedagogical purposes, wrap it in a Markdown cell as a code block rather than an executable code cell.
Create a separate install.R file in your project directory listing all required packages:
# install.R — this file is executed by Binder when building the environment
install.packages("tidyverse")
install.packages("tidytext")
install.packages("flextable")
install.packages("quanteda")
install.packages("quanteda.textstats")Binder installs the latest CRAN versions by default. For long-term reproducibility, pin specific versions in install.R:
devtools::install_version("tidytext", version = "0.4.1")This prevents a future package update from breaking your notebook.
Review every code chunk and adjust its options for an interactive notebook context:
In .Rmd | In notebook | Reason |
|---|---|---|
`echo=FALSE` | Remove — readers should see the code | The primary value of an interactive notebook is seeing the code |
`include=FALSE` | Remove — all cells should be visible | Hidden cells confuse readers who execute cells one by one |
`eval=FALSE` | Remove (unless demo code) — all cells should be executable | Readers expect every visible code cell to be runnable |
`message=FALSE, warning=FALSE` | Consider keeping — suppresses distracting output | Package load messages are still distracting in notebook output |
`fig.height=5, fig.width=7` | Keep — still valid in Jupyter R kernel | Figure dimensions apply equally in Jupyter |
`cache=TRUE` | Remove — Binder does not persist cache between sessions | Each Binder session starts fresh; cached files do not exist |
flextable with knitr::kableflextable tables do not render correctly in Jupyter notebooks — the HTML output requires a browser context that Jupyter’s cell output model does not always provide. Replace flextable() calls with knitr::kable() for notebook versions:
# In .Rmd (canonical source)
results |>
  flextable() |>
  theme_zebra() |>
  set_caption("Top 20 words by frequency")

# In _cb.Rmd (notebook version) — replace with:
knitr::kable(results, caption = "Top 20 words by frequency")In a Binder environment, all files are accessed relative to the repository root. Absolute paths (e.g. C:/Users/martin/data/corpus.csv) will break. Use relative paths:
# Wrong — absolute path breaks in Binder
corpus <- read.csv("C:/Users/martin/Documents/project/data/corpus.csv")

# Correct — relative path works in any environment
corpus <- read.csv("data/corpus.csv")
Ensure all data files referenced in your notebook are committed to the GitHub repository under their referenced paths. If files are large (over 50 MB), consider hosting them externally and loading them via URL, or use Git LFS.
Because notebook readers may be unfamiliar with your project, add a short Markdown cell at the top (after the title heading) explaining:
A good template:
# Frequency Analysis of the BNC

This notebook demonstrates corpus frequency analysis using the British National Corpus
(BNC) baby sample. It is an interactive companion to the paper
"Frequency Profiles in L1 and L2 English" (Schweinberger 2026).

**To use this notebook:** Click on a code cell and press **Shift+Enter** to execute it.
Work through the cells from top to bottom. All required packages are pre-installed.

**Data:** The BNC baby sample is included in the `data/` folder of this repository.

**Requirements:** This notebook uses R 4.3+ with the packages listed in `install.R`.Check |
|---|
Duplicated source file as `_cb.Rmd` |
YAML header (including `---` delimiters) removed |
First-level heading added as notebook title |
`install.packages()` calls removed from notebook |
`install.R` created with all required packages |
`echo=FALSE` and `include=FALSE` options removed |
`eval=FALSE` options removed (except demo code) |
`cache=TRUE` options removed |
`flextable()` replaced with `knitr::kable()` |
All file paths are relative (not absolute) |
All data files are in the repository |
Narrative introduction added at the top |
What you will learn: How to install and use the rmd2jupyter package; what the conversion produces; and how to verify the output
rmd2jupyterThe rmd2jupyter package is not on CRAN — install it directly from GitHub:
install.packages("devtools")
devtools::install_github("mkearney/rmd2jupyter")
Load the package:
library(rmd2jupyter)Point rmd2jupyter() at your prepared _cb.Rmd file:
rmd2jupyter::rmd2jupyter("my_analysis_cb.Rmd")This reads the .Rmd file, maps each section to the appropriate Jupyter cell type (Markdown prose → Markdown cell; R code chunk → code cell), and writes a .ipynb JSON file with the same base name:
my_analysis_cb.Rmd → my_analysis_cb.ipynbThe .ipynb file is written to the same directory as the input file.
In .Rmd | In .ipynb |
|---|---|
Markdown prose (between chunks) | Markdown cell |
R code chunk (` ```{r} `) | Code cell (R kernel) |
Inline R expression (`` `r expr` ``) | Evaluated and result embedded in Markdown cell |
YAML header | Ignored / must be removed first |
Chunk options (`echo`, `eval`, etc.) | Stripped — not carried into notebook |
HTML comments (`<!-- ... -->`) | Stripped |
After conversion, open the .ipynb file to verify it looks correct. You can preview it directly on GitHub (which renders notebooks as static HTML), or install JupyterLab locally:
# Install JupyterLab via pip (requires Python)
pip install jupyterlab

# Launch JupyterLab in the project directory
jupyter lab
Then open your .ipynb file in JupyterLab and do a quick sanity check:
## ---- lines)Push the .ipynb file to your GitHub repository and navigate to it in the browser. GitHub renders .ipynb files as formatted, syntax-highlighted static previews — useful for a quick visual check without installing any extra software. Note that code outputs are only visible in the static preview if the notebook was saved with outputs; a freshly converted notebook will show code cells but no outputs until the notebook is executed.
If your source file is a .qmd rather than .Rmd, the process is slightly different because rmd2jupyter does not directly support Quarto’s #| chunk option syntax. The recommended approach is to first convert the .qmd to .Rmd format:
# Convert a Quarto document to R Markdown first
quarto::quarto_render(
  "my_analysis.qmd",
  output_format = "md"
)
# Then manually clean up the output and convert to .ipynb
rmd2jupyter::rmd2jupyter("my_analysis.md")
Alternatively, rename the .qmd to .Rmd and replace all #| chunk options with the equivalent {r label, option=value} header syntax before running rmd2jupyter.
What you will learn: What Binder is and how it works; how to set up the ATAP/LDaCA Binder template repository on GitHub; how to upload your notebook and data files; and how to configure the R environment
Binder (mybinder.org) is a free, open service run by the Binder Project (a NumFOCUS project) that turns any GitHub repository into a live, executable Jupyter environment in the cloud. When someone clicks a Binder link, the service:
install.R, runtime.txt, etc.)The first build can take several minutes (sometimes up to an hour for complex environments), but subsequent launches use a cached image and start in seconds. Sessions are temporary — all edits are lost when the session closes, but users can download their modified notebook.
Users do not need a GitHub account or any installed software to use your Binder link. Any browser works. Sessions have resource limits (typically 1–2 GB RAM) — keep memory usage modest and avoid analyses that require large datasets loaded entirely into memory.
The Australian Text Analytics Platform (ATAP) and Language Data Commons of Australia (LDaCA) maintain a Binder-ready R template that pre-configures the Docker environment correctly for R notebooks.
Go to the template repository: github.com/Australian-Text-Analytics-Platform/r-binder-template
Click Use this template → Create a new repository
Always use Use this template rather than Fork. Forking creates a copy that is linked to the original in ways that can complicate your independent development. The template option creates a clean, independent repository under your account.
Give your repository a descriptive name (e.g. freq-analysis-notebook, bnc-collocations)
Leave the repository Public — Binder only works with public repositories
Click Create repository
The template contains several pre-configured files that you should understand before modifying:
File | Purpose |
|---|---|
`install.R` | R packages to install. Binder runs this script when building the image. |
`runtime.txt` | Specifies the R version (e.g. `r-4.3-2024-01-01`). Controls which CRAN snapshot is used. |
`apt.txt` | System-level dependencies (e.g. `libxml2-dev`). Most R packages do not need this. |
`.binder/` | Alternative location for Binder config files. Usually not needed with the ATAP template. |
`README.md` | Description of the repository. Replace placeholder content with your project description. |
`*.ipynb` (placeholder) | Placeholder notebook. Replace with your own `.ipynb` file. |
install.ROpen install.R and list every R package your notebook requires. This file is executed by Binder during the Docker image build — every package listed here will be available when a user launches your notebook.
# install.R — Binder executes this when building the environment

# Core data manipulation and visualisation
install.packages("tidyverse")
install.packages("ggplot2")

# Text analysis
install.packages("tidytext")
install.packages("quanteda")
install.packages("quanteda.textstats")
install.packages("quanteda.textplots")

# Tables (use knitr::kable in notebooks, not flextable)
install.packages("knitr")
install.packages("kableExtra")

# Any other packages your notebook uses
install.packages("readxl")
install.packages("scales")install.R Minimal
Every package in install.R increases the Docker build time. Only list packages that are actually called in your notebook. A leaner install.R means faster Binder launch times for your users.
runtime.txtThe runtime.txt file pins the R version and CRAN snapshot date, ensuring reproducibility:
r-4.3-2024-01-01The format is r-MAJOR.MINOR-YYYY-MM-DD. Binder uses the Rocker Project to build the R environment and the MRAN/CRAN snapshot for the specified date. Update the date to the date on which you tested your notebook to ensure package versions match.
Upload your .ipynb file to the repository:
.ipynb file or click choose your filesAdd frequency analysis notebook)Delete the placeholder .ipynb file that came with the template.
If your notebook loads data from files, those files must be in the repository:
For organisation, place data files in a data/ subfolder. To create a subfolder on GitHub (which does not allow creating empty folders directly):
data/placeholder.txtplaceholder)data/ and delete placeholder.txtGitHub has a 100 MB limit per file and a 1 GB soft limit per repository. If your data files are large:
git lfs track "*.csv")# Loading data from a URL in your notebook
corpus <- read.csv("https://zenodo.org/record/XXXXX/files/corpus.csv")Replace the template README with a description of your project. A good notebook README includes:
# Frequency Analysis of the BNC
This repository contains an interactive Jupyter notebook for corpus frequency
analysis, companion to Schweinberger (2026).
[](https://mybinder.org/v2/gh/YOUR-USERNAME/YOUR-REPO/main?urlpath=lab/tree/my_analysis_cb.ipynb)
## How to use
Click the Binder badge above to launch the notebook in your browser.
No installation required.
## Citation
Schweinberger, Martin. 2026. ...
---
*This repo was generated from the [ATAP/LDaCA r-binder-template](https://github.com/Australian-Text-Analytics-Platform/r-binder-template).*A Binder badge is a clickable button that launches your notebook directly. Add it to your README and to any associated tutorial or paper.
The badge URL format is:
https://mybinder.org/v2/gh/YOUR-USERNAME/YOUR-REPO/main?urlpath=lab/tree/YOUR-NOTEBOOK.ipynbThe Markdown for the badge image:
[](https://mybinder.org/v2/gh/YOUR-USERNAME/YOUR-REPO/main?urlpath=lab/tree/my_analysis_cb.ipynb)Replace YOUR-USERNAME, YOUR-REPO, and my_analysis_cb.ipynb with your actual values.
What you will learn: How to trigger the first Binder build; what happens during the build process; how to share the link; and what users experience when they open the notebook
Navigate to the Binder URL in your browser:
https://mybinder.org/v2/gh/YOUR-USERNAME/YOUR-REPO/main?urlpath=lab/tree/YOUR-NOTEBOOK.ipynbBinder will show a build log as it:
install.R and runtime.txt| Environment complexity | Approximate first build time |
|---|---|
| 3–5 packages | 5–15 minutes |
| 10–20 packages | 15–30 minutes |
| 30+ packages (e.g. tidyverse + quanteda) | 30–60 minutes |
Subsequent launches use the cached image and take 30–60 seconds. If you push a new commit to the repository, Binder rebuilds the image — allow extra time after updates.
When a user clicks your Binder link:
Remind users in your notebook’s introduction that sessions are temporary — any changes they make will be lost unless they download the notebook (File → Download).
What you will learn: What Google Colab is; how it differs from Binder; how to upload and run your R notebook on Colab; and when to prefer Colab over Binder
Google Colaboratory (Colab) is Google’s hosted Jupyter notebook service. Like Binder, it allows anyone to run a notebook in a browser without local installation. Unlike Binder, it:
install.R file — packages must be installed inside the notebookFeature | Binder | Google Colab |
|---|---|---|
Requires user account | No — anyone with the link can use it | Yes — Google account required |
Build time | 5–60 min first build; 30–60 s after | ~1 minute (always fresh) |
Session duration | Up to 6 hours; resets on close | 12 hours active; 90 min idle |
R support | Yes — via Rocker R images | Limited — Python-first; R via rpy2 or IRkernel |
Package installation | Via `install.R` (pre-installed at build time) | Must `install.packages()` at session start |
Data persistence | No — session resets on close | Via Google Drive (manual save) |
GPU access | No | Yes — free T4 GPU |
Integration with GitHub | Yes — launches directly from a GitHub repo | Yes — can open .ipynb from GitHub |
Offline access | No | No |
Best for | Public notebooks with pre-installed R packages | Python-heavy ML; users with Google accounts |
Colab is Python-first. To run R code, you need to switch the runtime to an R kernel:
Now add a code cell at the top of the notebook that installs all required packages (since Colab does not read install.R):
# Run this cell first — installs all required packages
install.packages("tidyverse")
install.packages("tidytext")
install.packages("quanteda")
install.packages("kableExtra")Unlike Binder (which pre-installs packages in the Docker image), Colab installs packages from scratch every session. For notebooks with many packages, this can take several minutes at the start of each session. Add a note to your notebook introduction explaining this.
To open a .ipynb file from GitHub directly in Colab:
.ipynb file from the listOr construct a direct URL:
https://colab.research.google.com/github/YOUR-USERNAME/YOUR-REPO/blob/main/YOUR-NOTEBOOK.ipynbAdd a Colab badge to your README alongside the Binder badge:
[](https://colab.research.google.com/github/YOUR-USERNAME/YOUR-REPO/blob/main/YOUR-NOTEBOOK.ipynb)Use Binder when: your audience may not have a Google account; you want packages pre-installed without a setup cell; your notebook is R-first; or you want tight integration with a GitHub repository.
Use Colab when: your audience is comfortable with Google accounts; you need longer session times; you need GPU access; or your notebook also includes Python code.
For maximum accessibility, provide both links and let users choose.
What you will learn: Design principles for creating notebooks that are clear, reproducible, and pleasant to use for a reader who is running the code interactively
A well-designed interactive notebook tells a story. Every code cell should be preceded by a Markdown cell explaining what the code does and why. Think of the notebook as a document with executable examples — not a script with comments.
Principle | Detail |
|---|---|
One action per cell | Each code cell should do one clearly defined thing. Split large cells into smaller steps. |
Explain before you code | Always precede a code cell with a Markdown cell that explains what it does and what to expect. |
Explain after outputs | After a complex output (plot, table, model summary), add a Markdown cell interpreting the result. |
Use headings consistently | Use `#` for the notebook title, `##` for major sections, `###` for subsections — consistently. |
Keep cells short | Aim for code cells of 5–15 lines. Long cells are harder to understand and harder to debug. |
Never assume prior cells ran | Each section should be independently runnable, or at least have clear dependencies documented. |
Always run top-to-bottom before sharing | Use Kernel → Restart & Run All to verify the notebook runs cleanly from a fresh state. |
Add a 'Run all cells' instruction | Tell readers in the introduction: click Run → Run All Cells or work through cells with Shift+Enter. |
Practice | Why |
|---|---|
Set a random seed | Any random process (sampling, bootstrapping, k-means) must use `set.seed()` for reproducibility |
Pin package versions in `install.R` | Package updates can silently change function behaviour and break notebooks |
Pin the R version in `runtime.txt` | R version affects package compatibility and default behaviour |
Use relative file paths | Absolute paths break on any machine other than the original |
Include `sessionInfo()` at the end | Allows readers to see exactly which package versions produced the results |
Commit data files to the repo | The notebook must be self-contained — no missing files |
Clear all outputs before committing | Outputs in `.ipynb` JSON inflate file size and create noisy diffs |
Test in a fresh Binder session | Verifies the notebook runs correctly in the exact environment users will encounter |
scale_color_viridis_d() in ggplot2Before sharing or committing a notebook, clear all outputs:
.ipynb file small and the Git diff cleanException: if your notebook takes a long time to run (e.g. large models), you may want to leave outputs in place so readers can see the expected results without running everything.
What you will learn: How to diagnose and fix the most common problems encountered at each stage of the notebook creation and deployment workflow
Problem | Cause | Fix |
|---|---|---|
Binder build fails immediately with a config error | `runtime.txt` format is wrong, or `install.R` has a syntax error | Check `runtime.txt` format is exactly `r-4.3-YYYY-MM-DD`; test `install.R` locally with `source('install.R')` |
Binder build takes over 60 minutes | Too many packages, or a package with many compiled dependencies (e.g. `rJava`) | Reduce packages in `install.R` to only what is needed; split into multiple lighter notebooks |
Binder launches but notebook gives 'package not found' error | Package is missing from `install.R` | Add the missing package to `install.R`, commit, and wait for Binder to rebuild |
Binder launches but data file not found | Data file was not committed to the repository, or path is wrong | Commit the data file to the repo; verify the path in the notebook matches the repo structure |
Plots do not display in Binder | Some graphics devices are not available in all Jupyter R kernels | Add `options(bitmapType='cairo')` at the top of your notebook's setup cell |
`rmd2jupyter` conversion produces garbled Markdown | The source `.Rmd` used unusual chunk option syntax that confused the parser | Clean up the `_cb.Rmd` file manually; remove non-standard options before converting |
YAML content appears at the top of the converted notebook | The YAML block (including `---` delimiters) was not fully removed | Re-open `_cb.Rmd` and delete everything between and including the `---` delimiters |
Stray `## ----` lines appear in code cells | knitr section labels (`## ---- label`) were not cleaned from the source | Remove all `## ----` knitr section label lines from `_cb.Rmd` before converting |
Colab disconnects before analysis finishes | Long-running analysis exceeds Colab's 90-minute idle timeout | Break long analyses into shorter notebooks; add intermediate save points with `saveRDS()` |
`.ipynb` file is very large (>10 MB) | Notebook was committed with all outputs saved in the JSON | In JupyterLab, Edit → Clear All Outputs, save, then commit |
GitHub push fails — file too large | A data file exceeds GitHub's 100 MB file size limit | Use Git LFS for files 50–100 MB; host files over 100 MB on Zenodo/OSF and load via URL |
Session resets and all work is lost on Binder | Binder sessions are always temporary — this is by design | Tell users in the intro to download modified notebooks via File → Download before closing |
`flextable` output shows raw HTML in notebook | `flextable` relies on HTML rendering context not available in all Jupyter views | Replace `flextable()` with `knitr::kable()` in the `_cb.Rmd` before conversion |
Martin Schweinberger. 2026. Creating Interactive Jupyter Notebooks. The Language Technology and Data Analysis Laboratory (LADAL), The University of Queensland, Australia. url: https://ladal.edu.au/tutorials/jupyter/jupyter.html (Version 3.1.1). doi: 10.5281/zenodo.19332892.
@manual{martinschweinberger2026creating,
  author       = {Martin Schweinberger},
  title        = {Creating Interactive Jupyter Notebooks},
  year         = {2026},
  note         = {https://ladal.edu.au/tutorials/jupyter/jupyter.html},
  organization = {The Language Technology and Data Analysis Laboratory (LADAL), The University of Queensland, Australia},
  edition      = {2026.03.27}
  doi      = {}
}sessionInfo()R version 4.4.2 (2024-10-31 ucrt)
Platform: x86_64-w64-mingw32/x64
Running under: Windows 11 x64 (build 26200)
Matrix products: default
locale:
[1] LC_COLLATE=English_United States.utf8
[2] LC_CTYPE=English_United States.utf8
[3] LC_MONETARY=English_United States.utf8
[4] LC_NUMERIC=C
[5] LC_TIME=English_United States.utf8
time zone: Australia/Brisbane
tzcode source: internal
attached base packages:
[1] stats graphics grDevices datasets utils methods base
other attached packages:
[1] flextable_0.9.11 rmd2jupyter_0.1.0 devtools_2.4.5 usethis_3.1.0
loaded via a namespace (and not attached):
[1] gtable_0.3.6 xfun_0.56 ggplot2_4.0.2
[4] htmlwidgets_1.6.4 remotes_2.5.0 vctrs_0.7.1
[7] tools_4.4.2 generics_0.1.3 tibble_3.2.1
[10] klippy_0.0.0.9500 pkgconfig_2.0.3 data.table_1.17.0
[13] RColorBrewer_1.1-3 S7_0.2.1 assertthat_0.2.1
[16] uuid_1.2-1 lifecycle_1.0.5 compiler_4.4.2
[19] farver_2.1.2 textshaping_1.0.0 codetools_0.2-20
[22] httpuv_1.6.15 fontquiver_0.2.1 fontLiberation_0.1.0
[25] htmltools_0.5.9 yaml_2.3.10 later_1.4.1
[28] pillar_1.10.1 urlchecker_1.0.1 tidyr_1.3.2
[31] ellipsis_0.3.2 openssl_2.3.2 cachem_1.1.0
[34] sessioninfo_1.2.3 mime_0.12 fontBitstreamVera_0.1.1
[37] tidyselect_1.2.1 zip_2.3.2 digest_0.6.39
[40] stringi_1.8.4 dplyr_1.2.0 purrr_1.0.4
[43] fastmap_1.2.0 grid_4.4.2 cli_3.6.4
[46] magrittr_2.0.3 patchwork_1.3.0 pkgbuild_1.4.6
[49] gdtools_0.5.0 scales_1.4.0 promises_1.3.2
[52] rmarkdown_2.30 officer_0.7.3 askpass_1.2.1
[55] ragg_1.3.3 memoise_2.0.1 shiny_1.10.0
[58] evaluate_1.0.3 knitr_1.51 miniUI_0.1.1.1
[61] profvis_0.4.0 rlang_1.1.7 Rcpp_1.1.1
[64] xtable_1.8-4 glue_1.8.0 xml2_1.3.6
[67] renv_1.1.7 pkgload_1.4.0 rstudioapi_0.17.1
[70] jsonlite_1.9.0 R6_2.6.1 systemfonts_1.3.1
[73] fs_1.6.5 This tutorial was re-developed with the assistance of Claude (claude.ai), a large language model created by Anthropic. Claude was used to help revise the tutorial text, structure the instructional content, generate the R code examples, and write the checkdown quiz questions and feedback strings. All content was reviewed, edited, and approved by the author (Martin Schweinberger), who takes full responsibility for the accuracy and pedagogical appropriateness of the material. The use of AI assistance is disclosed here in the interest of transparency and in accordance with emerging best practices for AI-assisted academic content creation.