
Introduction

This tutorial introduces basic data management techniques and methods to keep your folders clean and tidy.
This tutorial is designed to provide essential guidance on data management for individuals working with language data. While it is accessible to all users, it focuses particularly on beginners aiming to enhance their data management skills.
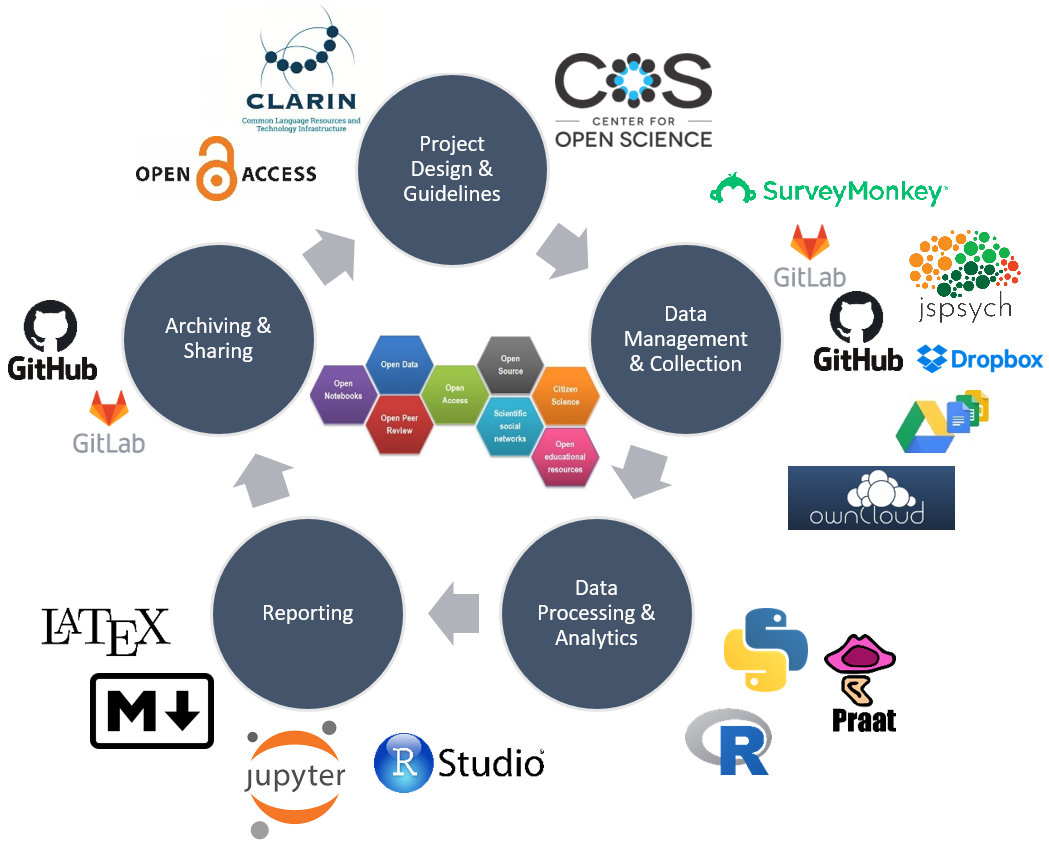
The objective of this tutorial is to demonstrate fundamental data management strategies and exemplify how to implement methods that improve the your folder structures and workflows. By following this tutorial, users will learn to implement best practices in data managementthat ensure their workflows are transparent. These methods are crucial for creating analyses that others can easily understand, verify, and build upon. By adopting these practices, you contribute to a more open and collaborative scientific community.
In empirical research or when working with data more generally, issues relating to organising files and folders, managing data and projects, avoiding data loss, and efficient workflows are essential. The idea behind this tutorial is to address these issues and provide advice on how to handle data and create efficient workflows.
Some of the contents of this tutorial build on the Digital Essentials module that is offered by the UQ library, the Reproducible Research resources (created by Griffith University’s Library and eResearch Services), and on Amanda Miotto’s Reproducible Reseach Things (see also here for an alternative version and here for the GitHub repo). You can find additional information on all things relating to computers, the digital world, and computer safety in the Digital Essentials course that is part of UQ’s library resources.
Basic concepts
This section introduces some basic concepts and provides useful tips for managing your research data.
What is Data Management?
Data management refers to the comprehensive set of practices, policies, and processes used to manage data throughout its lifecycle (Corea 2019, chap. 1). This involves ensuring that data is collected, stored, processed, and maintained in a way that it can be effectively used for analytical purposes. Good data management is crucial for enabling accurate, reliable, and meaningful analysis.
Key components of data management in data analytics include:
Data Collection and Acquisition: Gathering data from various sources, which can include databases, APIs, sensors, web scraping, and more. The goal is to ensure the data is collected in a systematic and consistent manner.
Data Storage: Utilising databases, data warehouses, data lakes, or cloud storage solutions to store collected data securely and efficiently. This ensures that data is easily accessible for analysis.
Data Cleaning and Preparation: Involves identifying and correcting errors or inconsistencies in the data to improve its quality. This step is critical for ensuring the accuracy of any subsequent analysis.
Data Integration: Combining data from different sources into a single, unified dataset. This often involves ETL (Extract, Transform, Load) processes where data is extracted from different sources, transformed into a consistent format, and loaded into a central repository.
Data Governance: Establishing policies and procedures to ensure data is managed properly. This includes defining roles and responsibilities, ensuring data privacy and security, and maintaining compliance with regulations.
Data Security: Implementing measures to protect data from unauthorised access, breaches, and other threats. This involves encryption, access controls, and regular security audits.
Data Analysis: Using statistical methods, algorithms, and software tools to analyze data and extract meaningful insights. This can involve descriptive, predictive, and prescriptive analytics.
Data Visualisation: Presenting data in graphical or pictorial formats such as charts, graphs, and dashboards to help users understand trends, patterns, and insights more easily.
Data Quality Management: Continuously monitoring and maintaining the accuracy, consistency, and reliability of data. This involves data profiling, validation, and auditing.
Metadata Management: Managing data about data, which includes documenting the data’s source, format, and usage. Metadata helps in understanding the context and provenance of the data.
Data Lifecycle Management: Managing data through its entire lifecycle, from initial creation and storage to eventual archiving and deletion. This ensures that data is managed in a way that supports its long-term usability and compliance with legal requirements.
Effective data management practices ensure that data is high quality, well-organised, and accessible, which is essential for accurate and actionable data analytics. By implementing robust data management strategies, organisations can improve the reliability of their analyses, make better-informed decisions, and achieve greater operational efficiency.
For further reading and deeper insights, consider these resources: - Data Management Association International (DAMA) - Data Management Body of Knowledge (DAMA-DMBOK) - Gartner’s Data Management Solutions
We now move on to some practical tips and tricks on how to implement transparent and well-documented research practices.
Organising Projects
In this section, we focus on what researchers can do to render their workflows more transparent, recoverable, and reproducible.
A very easy-to-implement, yet powerful method for maintaining a tidy and transparent workflow relates to project management and organisation. Below are some tips to consider when planning and organising projects.
Folder Structures
Different methods of organising your folders have unique advantages and challenges, but they all share a reliance on a tree-structure hierarchy, where more general folders contain more specialised subfolders. For instance, if your goal is to locate any file with minimal clicks, an alphabetical folder structure might be effective. In this system, items are stored based on their initial letter (e.g., everything starting with a “T” like “travel” under “T”, or everything related to “courses” under “C”). However, this method can be unintuitive as it groups completely unrelated topics together simply because they share the same initial letter.
A more common and intuitive approach is to organise your data into meaningful categories that reflect different aspects of your life. For example:
Work: This can include subfolders like Teaching and Research.
Personal: This can encompass Rent, Finances, and Insurances.
Media: This might include Movies, Music, and Audiobooks.
This method not only makes it easier to locate files based on context but also keeps related topics grouped together, enhancing both accessibility and logical organisation.
To further improve folder organisation, consider the following best practices:
- Consistency: Use a consistent naming convention to avoid confusion.
- Clarity: Use clear and descriptive names for folders and files.
- Date-Based Organisation: For projects that evolve over time, include dates in the folder names.
- Regular Maintenance: Periodically review and reorganise your folders to keep them tidy and relevant.
Folders and files should be labeled in a meaningful and consistent way to avoid ambiguity and confusion. Avoid generic names like Stuff or Documents for folders, and doc2 or homework for files. Naming files consistently, logically, and predictably helps prevent disorganisation, misplaced data, and potential project delays. A well-thought-out file naming convention ensures that files are:
- Easier to Process: Team members won’t have to overthink the file naming process, reducing cognitive load.
- Easier to Access, Retrieve, and Store: A consistent naming convention facilitates quick and easy access to files.
- Easier to Browse Through: Organised files save time and effort when searching through directories.
- Harder to Lose: A logical structure makes it less likely for files to be misplaced.
- Easier to Check for Obsolete or Duplicate Records: Systematic naming aids in identifying and managing outdated or redundant files.
The UQ Library offers the Digital Essentials module Working with Files. This module contains information on storage options, naming conventions, back up options, metadata, and file formats. Some of these issues are dealt with below but the materials provided by the library offer a more extensive introduction into these topics.
By implementing these strategies, you can create a folder structure that is not only efficient but also scalable, accommodating both your current needs and future expansions.
Folders for Research and Teaching
Having a standard folder structure can keep your files neat and tidy and save you time looking for data. It can also help if you are sharing files with colleagues and have a standard place to put working data and documentation.
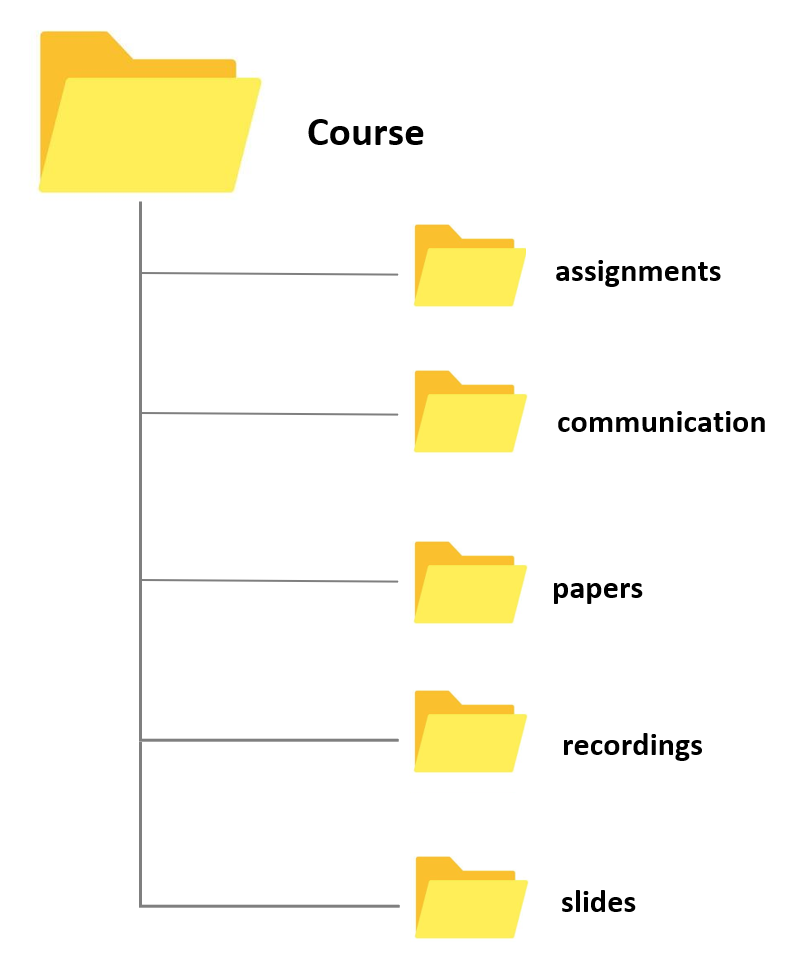
Store your projects in a separate folder. For instance, if you are creating a folder for a research project, create the project folder within a separate project folder that is within a research folder. If you are creating a folder for a course, create the course folder within a courses folder within a teaching folder, etc.
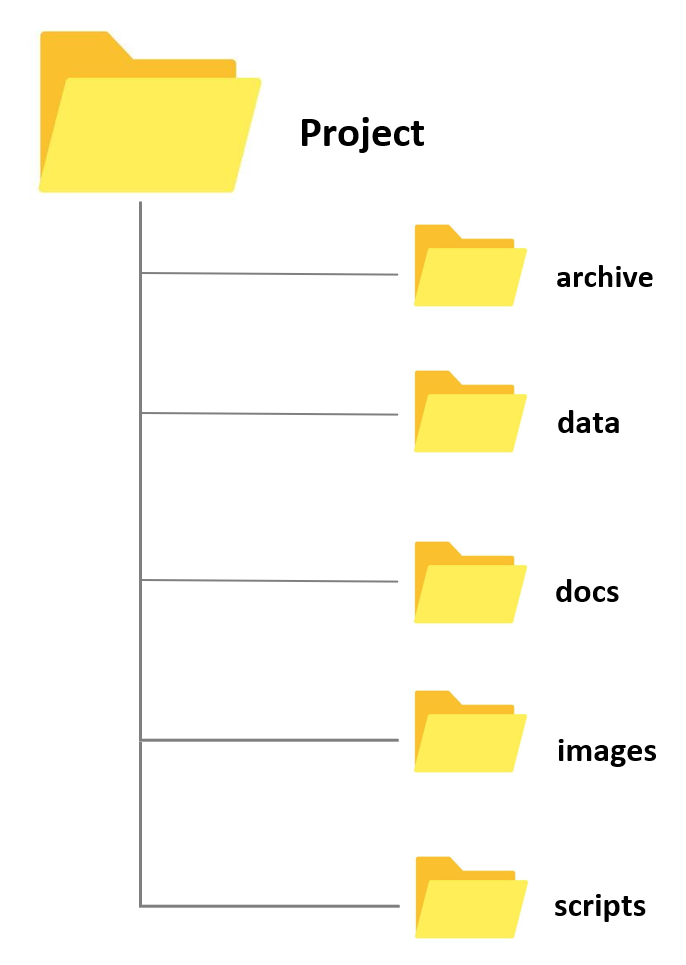
Whenever you create a folder for a new project, try to have a set of standard folders. For example, when I create research project folders, I always have folders called archive, data, docs, and images. When I create course folders, I always have folders called slides, assignments, exam, studentmaterials, and correspondence. However, you are, of course, free to modify and come up with or create your own basic project design. Also, by prefixing the folder names with numbers, you can force your files to be ordered by the steps in your workflow.
- Having different sub folders allows you to avoid having too many files and many different file types in a single folder. Folders with many different files and file types tend to be chaotic and can be confusing. In addition, I have one ReadMe file on the highest level (which only contains folders except for this one single file) in which I describe very briefly what the folder is about and which folders contain which documents as well as some basic information about the folder (e.g. why and when I created it). This ReadMe file is intended both for me, as a reminder of what this folder is about and what it contains, and also for others, in case I hand a project over to someone else who continues it or someone takes over my course and needs to use my materials.
Shared Folder Structures
If you work in a team or regularly share files and folders, establishing a logical structure for collaboration is essential. Here are key considerations for developing an effective team folder structure:
Pre-existing Agreements: Before implementing a new folder structure, ensure there are no existing agreements or conventions in place. Collaborate with team members to assess the current system and identify areas for improvement.
Meaningful Naming: Name folders in a way that reflects their contents and purpose. Avoid using staff names and opt for descriptive labels that indicate the type of work or project. This ensures clarity and accessibility for all team members.
Consistency: Maintain consistency across the folder hierarchy to facilitate navigation and organisation. Adhere to the agreed-upon structure and naming conventions to streamline workflows and minimise confusion.
Hierarchical Structure: Organise folders hierarchically, starting with broad categories and gradually narrowing down to more specific topics. This hierarchical arrangement enhances organisation and facilitates efficient file retrieval.
Differentiate Ongoing and Completed Work: Differentiate between ongoing and completed work by segregating folders accordingly. As projects progress and accumulate files, separating older documents from current ones helps maintain clarity and focus.
Backup Solutions: Implement robust backup solutions to safeguard against data loss in the event of a disaster. Utilise university-provided storage solutions or external backup services to ensure files are securely backed up and retrievable.
Post-Project Clean-up: Conduct regular clean-up activities to remove redundant or obsolete files and folders post-project completion. This declutters the workspace, improves efficiency, and ensures that relevant data remains easily accessible.
By following these guidelines, teams can establish a cohesive and efficient folder structure that promotes collaboration, organisation, and data integrity.
GOING FURTHER
For Beginners
Pick some of your projects and illustrate how you currently organise your files. See if you can devise a better naming convention or note one or two improvements you could make to how you name your files.
There are some really good folder template shapes around. Here is one you can download.
For Advanced Folder designers
- Come up with a policy for your team for folder structures. You could create a template and put it in a downloadable location for them to get them started.
File Naming Convention (FNC)
One of the most basic but also most important practices a researcher can do to improve the reproducibility and transparency of their research is to follow a consistent file naming convention. A File Naming Convention (FNC) is a systematic framework for naming your files in a way that clearly describes their contents and, importantly, how they relate to other files. Establishing an agreed-upon File Naming Convention before collecting data is essential as it ensures consistency, improves organisation, and facilitates easier retrieval and collaboration. By establishing a clear and consistent File Naming Convention, you can significantly improve the efficiency and effectiveness of your data management practices, making it easier to handle, share, and preserve important information.
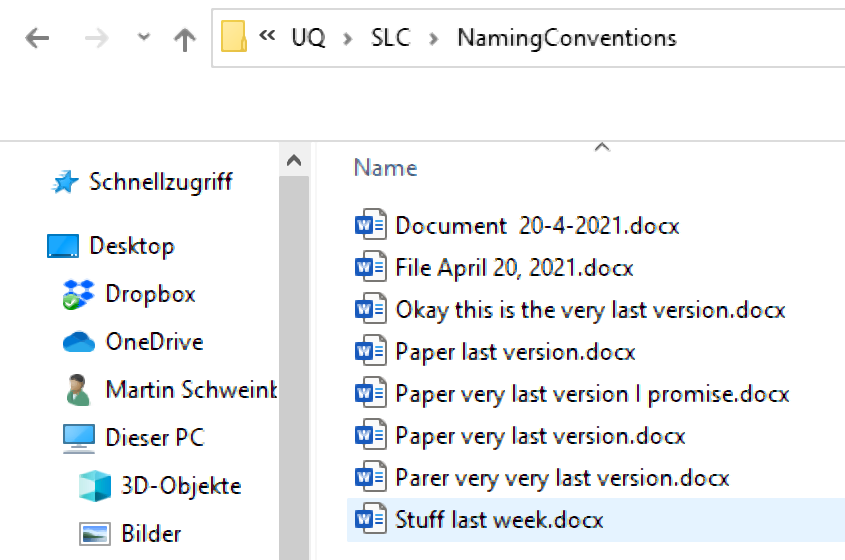
Key elements to consider when creating a File Naming Convention include:
Descriptive Names: Use clear and descriptive names that provide information about the file’s content, purpose, and date. Avoid vague or generic names.
Consistency: Apply the same naming format across all files to maintain uniformity. This includes using consistent date formats, abbreviations, and capitalisation.
Version Control: Incorporate version numbers or dates in the file names to track revisions and updates. For example, “ProjectReport_v1.0_2024-05-22.docx”.
Avoid Special Characters: Use only alphanumeric characters and underscores or hyphens to avoid issues with different operating systems or software.
Length and Readability: Keep file names concise yet informative. Avoid overly long names that may be difficult to read or cause problems with file path limitations.
Organisational Context: Use names that reflect the file’s place within the broader project or system. For example, use a prefix that indicates the department or project phase.
Example of a File Naming Convention:
[ProjectName]_[DocumentType]_[Date]_[Version].[Extension]
Example:
ClimateStudy_Report_20240522_v1.0.docx
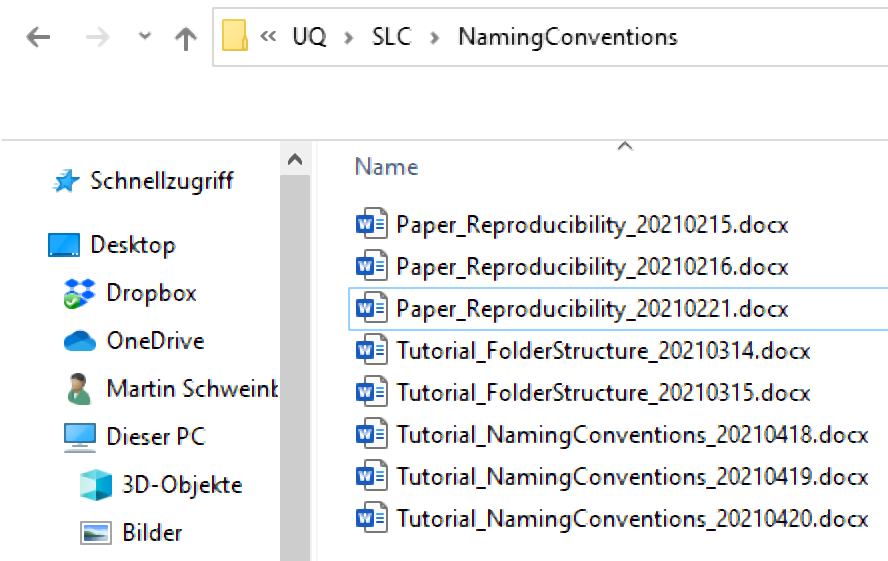
Here are some additional hints for optimising file naming:
Avoid Special Characters: Special characters like +, !, “, -, ., ö, ü, ä, %, &, (, ), [, ], &, $, =, ?, ’, #, or / should be avoided. They can cause issues with file sharing and compatibility across different systems. While underscores (_) are also special characters, they are commonly used for readability.
No White Spaces: Some software applications replace or collapse white spaces, which can lead to problems. A common practice is to capitalise initial letters in file names to avoid white spaces (e.g., TutorialIntroComputerSkills or Tutorial_IntroComputerSkills).
Include Time-Stamps: When adding dates to file names, use the YYYYMMDD format. This format ensures that files are easily sorted in chronological order. For example, use TutorialIntroComputerSkills20230522 or Tutorial_IntroComputerSkills_20230522.
Benefits of a robust File Naming Convention include:
- Enhanced Organisation: Files are easier to categorise and locate.
- Improved Collaboration: Team members can understand and navigate the file structure more efficiently.
- Consistency and Standardisation: Reduces errors and confusion, ensuring that everyone follows the same system.
- Streamlined Data Management: Simplifies the process of managing large volumes of data.
For comprehensive guidance, the University of Edinburgh provides a detailed list of 13 Rules for File Naming Conventions with examples and explanations. Additionally, the Australian National Data Service (ANDS) offers a useful guide on file wrangling, summarised below.
Data Handling and Management
The following practical tips and tricks focus on data handling and provide guidance to avoid data loss.
Keeping copies and the 3-2-1 Rule
Keeping a copy of all your data (working, raw, and completed) both in the cloud (recommended) and on your computer is incredibly important. This ensures that if you experience a computer failure, accidentally delete your data, or encounter data corruption, your research remains recoverable and restorable.
When working with and processing data, it is also extremely important to always keep at least one copy of the original data. The original data should never be deleted; instead, you should copy the data and delete only sections of the copy while retaining the original data intact.
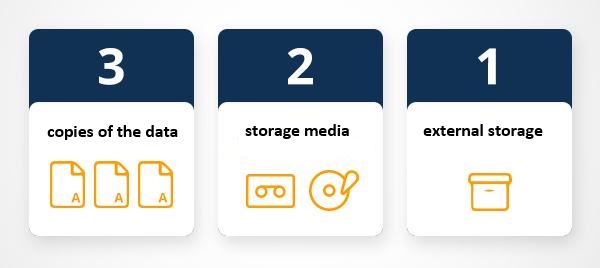
The 3-2-1 backup rule has been developed as a guide against data loss (Pratt 2021). According to this rule, one should strive to have at least three copies of your project stored in different locations. Specifically, maintain at least three (3) copies of your data, storing backup copies on two (2) different storage media, with one (1) of them located offsite. While this guideline may vary depending on individual preferences, I personally adhere to this approach for safeguarding my projects.

on my personal notebook
on at least one additional hard drive (that you keep in a secure location)
in an online repository (for example, UQ’s Research Data Management system (RDM) OneDrive, MyDrive, GitHub, or GitLab)
Using online repositories ensures that you do not lose any data in case your computer crashes (or in case you spill lemonade over it - don’t ask…) but it comes at the cost that your data can be more accessible to (criminal or other) third parties. Thus, if you are dealing with sensitive data, I suggest storing it on an additional external hard drive and not keeping cloud-based back-ups. If you trust tech companies with your data (or think that they are not interested in stealing your data), cloud-based solutions such as OneDrive, Google’s MyDrive, or Dropbox are ideal and easy to use options (however, UQ’s RDM is a safer option).
The UQ library also offers additional information on complying with ARC and NHMRC data management plan requirements and that UQ RDM meets these requirements for sensitive data (see here).
GOING FURTHER
For Beginners
- Get your data into UQ’s RDM or Cloud Storage - If you need help, talk to the library or your tech/eResearch/QCIF Support
For Advanced backupers
- Build a policy for your team or group on where things are stored. Make sure the location of your data is saved in your documentation
Dealing with Sensitive Data
This section will elaborate on how to organise and handle (research) data and introduce some basic principles that may help you to keep your data tidy.
Tips for sensitive data
- Sensitive data are data that can be used to identify an individual, species, object, or location that introduces a risk of discrimination, harm, or unwanted attention. Major, familiar categories of sensitive data are: personal data, health and medical data, and ecological data that may place vulnerable species at risk.
Separating identifying variables from your data
Separating or deidentifying your data has the purpose of protecting an individual’s privacy. According to the Australian Privacy Act 1988, “personal information is deidentified if the information is no longer about an identifiable individual or an individual who is reasonably identifiable”. Deidentified information is no longer considered personal information and can be shared. More information on the Commonwealth Privacy Act can be located here.
Deidentifying aims to allow data to be used by others for publishing, sharing and reuse without the possibility of individuals/location being re-identified. It may also be used to protect the location of archaeological findings, cultural data or locations of endangered species.
Any identifiers (name, date of birth, address or geospatial locations etc) should be removed from main data set and replaced with a code/key. The code/key is then preferably encrypted and stored separately. By storing de-identified data in a secure solution, you are meeting safety, controlled, ethical, privacy and funding agency requirements.
Re-identifying an individual is possible by recombining the de-identifiable data set and the identifiers.
Managing Deidentification (ARDC)
Plan deidentification early in the research as part of your data management planning
Retain original unedited versions of data for use within the research team and for preservation
Create a deidentification log of all replacements, aggregations or removals made
Store the log separately from the deidentified data files
Identify replacements in text in a meaningful way, e.g. in transcribed interviews indicate replaced text with [brackets] or use XML mark-up tags.
Management of identifiable data (ARDC)
Data may often need to be identifiable (i.e. contains personal information) during the process of research, e.g. for analysis. If data is identifiable then ethical and privacy requirements can be met through access control and data security. This may take the form of:
Control of access through physical or digital means (e.g. passwords)
Encryption of data, particularly if it is being moved between locations
Ensuring data is not stored in an identifiable and unencrypted format when on easily lost items such as USB keys, laptops and external hard drives.
Taking reasonable actions to prevent the inadvertent disclosure, release or loss of sensitive personal information.
Safely sharing sensitive data guide (ARDC)
- ANDS’ Deidentification Guide collates a selection of Australian and international practical guidelines and resources on how to deidentify data sets. You can find more information about deidentification here and information about safely sharing sensitive data here.
Australian practical guidance for Deidentification (ARDC)
- Australian Research Data Commons (ARDC) formerly known as Australian National Data Service (ANDS) released a fabulous guide on Deidentification. The Deidentification guide is intended for researchers who own a data set and wish to share safely with fellow researchers or for publishing of data. The guide can be located here.
Nationally available guidelines for handling sensitive data
The Australian Government’s Office of the Australian Information Commissioner (OAIC) and CSIRO Data61 have released a Deidentification Decision Making Framework, which is a “practical guide to deidentification, focusing on operational advice”. The guide will assist organisations that handle personal information to deidentify their data effectively.
The OAIC also provides high-level guidance on deidentification of data and information, outlining what deidentification is, and how it can be achieved.
The Australian Government’s guidelines for the disclosure of health information, includes techniques for making a data set non-identifiable and example case studies.
Australian Bureau of Statistics’ National Statistical Service Handbook. Chapter 11 contains a summary of methods to maintain privacy.
med.data.edu.au gives information about anonymisation
The Office of the Information Commissioner Queensland’s guidance on deidentification techniques can be found here
Data as publications
More recently, regarding data as a form of publications has gain a lot of traction. This has the advantage that it rewards researchers who put a lot of work into compiling data and it has created an incentive for making data available, e.g. for replication. The UQ RDM and UQ eSpace can help with the process of publishing a dataset.
There are many platforms where data can be published and made available in a sustainable manner. Listed below are just some options that are recommended:
UQ Research Data Manager
The UQ Research Data Manager (RDM) system is a robust, world-leading system designed and developed here at UQ. The UQ RDM provides the UQ research community with a collaborative, safe and secure large-scale storage facility to practice good stewardship of research data. The European Commission report “Turning FAIR into Reality” cites UQ’s RDM as an exemplar of, and approach to, good research data management practice. The disadvantage of RDM is that it is not available to everybody but restricted to UQ staff, affiliates, and collaborators.
Open Science Foundation
The Open Science Foundation (OSF) is a free, global open platform to support your research and enable collaboration.
TROLLing
TROLLing | DataverseNO (The Tromsø Repository of Language and Linguistics) is a repository of data, code, and other related materials used in linguistic research. The repository is open access, which means that all information is available to everyone. All postings are accompanied by searchable metadata that identify the researchers, the languages and linguistic phenomena involved, the statistical methods applied, and scholarly publications based on the data (where relevant).
Git
GitHub offers the distributed version control using Git. While GitHub is not designed to host research data, it can be used to share share small collections of research data and make them available to the public. The size restrictions and the fact that GitHub is a commercial enterprise owned by Microsoft are disadvantages of this as well as alternative, but comparable platforms such as GitLab.
Software
Using free, open-source software for data processing and analysis, such as Praat, R, Python, or Julia, promotes transparency and reproducibility by reducing financial access barriers and enabling broader audiences to conduct analyses. Open-source tools provide a transparent and accessible framework for conducting analyses, allowing other researchers to replicate and validate results while eliminating access limitations present in commercial tools, which may not be available to researchers from low-resource regions (see Heron, Hanson, and Ricketts 2013 for a case-study on the use of free imaging software).
In contrast, employing commercial tools or multiple tools in a single analysis can hinder transparency and reproducibility. Switching between tools often requires time-consuming manual input and may disadvantage researchers from low-resource regions who may lack access to licensed software tools. While free, open-source tools are recommended for training purposes, they may have limitations in functionality (Heron, Hanson, and Ricketts 2013, 7/36).
Documentation
Documentation involves meticulously recording your work so that others—or yourself at a later date—can easily understand what you did and how you did it. This practice is crucial for maintaining clarity and continuity in your projects. As a general rule, you should document your work with the assumption that you are instructing someone else on how to navigate your files and processes on your computer.
Efficient Documentation
Be Clear and Concise: Write in a straightforward and concise manner. Avoid jargon and complex language to ensure that your documentation is accessible to a wide audience.
Include Context: Provide background information to help the reader understand the purpose and scope of the work. Explain why certain decisions were made.
Step-by-Step Instructions: Break down processes into clear, sequential steps. This makes it easier for someone to follow your workflow.
Use Consistent Formatting: Consistency in headings, fonts, and styles improves readability and helps readers quickly find the information they need.
Document Locations and Structures: Clearly describe where files are located and the structure of your directories. Include details on how to navigate through your file system.
Explain File Naming Conventions: Detail your file naming conventions so others can understand the logic behind your organisation and replicate it if necessary.
Update Regularly: Documentation should be a living document. Regularly update it to reflect changes and new developments in your project.
Example
If you were documenting a data analysis project, your documentation might include:
- Project Overview: A brief summary of the project’s objectives, scope, and outcomes.
- Directory Structure: An explanation of the folder organisation and the purpose of each directory.
- Data Sources: Descriptions of where data is stored and how it can be accessed.
- Processing Steps: Detailed steps on how data is processed, including code snippets and explanations.
- Analysis Methods: An overview of the analytical methods used and the rationale behind their selection.
- Results: A summary of the results obtained and where they can be found.
- Version Control: Information on how the project is version-controlled, including links to repositories and branches.
By following these best practices, your documentation will be comprehensive and user-friendly, ensuring that anyone who needs to understand your work can do so efficiently. This level of detail not only aids in collaboration but also enhances the reproducibility and transparency of your projects.

Documentation and the Bus Factor
Documentation is not just about where your results and data are saved; it encompasses a wide range of forms depending on your needs and work style. Documenting your processes can include photos, word documents with descriptions, or websites that detail how you work.
The concept of documentation is closely linked to the Bus Factor (Jabrayilzade et al. 2022) — a measure of how many people on a project need to be unavailable (e.g., hit by a bus) for the project to fail. Many projects have a bus factor of one, meaning that if the key person is unavailable, the project halts. Effective documentation raises the bus factor, ensuring that the project can continue smoothly if someone suddenly leaves or is unavailable.
In collaborative projects, having a log of where to find relevant information and who to ask for help is particularly useful. Ideally, documentation should cover everything that a new team member needs to know. The perfect person to create this log is often the last person who joined the project, as they can provide fresh insights into what information is most needed.
Creating an Onboarding Log
If you haven’t created a log for onboarding new team members, it’s highly recommended. This log should be stored in a ReadMe document or folder at the top level of the project directory. This ensures that essential information is easily accessible to anyone who needs it.
By documenting thoroughly and effectively, you improve the resilience and sustainability of your project, making it less dependent on any single individual and enhancing its overall robustness.
GOING FURTHER
For Beginners
Read this first: How to start Documenting and more by CESSDA ERIC
Start with documenting in a text file or document- any start is a good start
Have this document automatically synced to the cloud with your data or keep this in a shared place such as Google docs, Microsoft teams, or Owncloud. If you collaborate on a project and use UQ’s RDM, you should store a copy of your documentation there.
For Intermediates
- Once you have the basics in place, go into detail on how your workflow goes from your raw data to the finished results. This can be anything from a detailed description of how you analyse your data, over R Notebooks, to downloaded function lists from Virtual Lab.
For Advanced documentarians
- Learn about Git Repositories and wikis.
Reproducible reports and notebooks
Notebooks seamlessly combine formatted text with executable code (e.g., R or Python) and display the resulting outputs, enabling researchers to trace and understand every step of a code-based analysis. This integration is facilitated by markdown, a lightweight markup language that blends the functionalities of conventional text editors like Word with programming interfaces. Jupyter notebooks (Pérez and Granger 2015) and R notebooks (Xie 2015) exemplify this approach, allowing researchers to interleave explanatory text with code snippets and visualise outputs within the same document. This cohesive presentation enhances research reproducibility and transparency by providing a comprehensive record of the analytical process, from code execution to output generation.
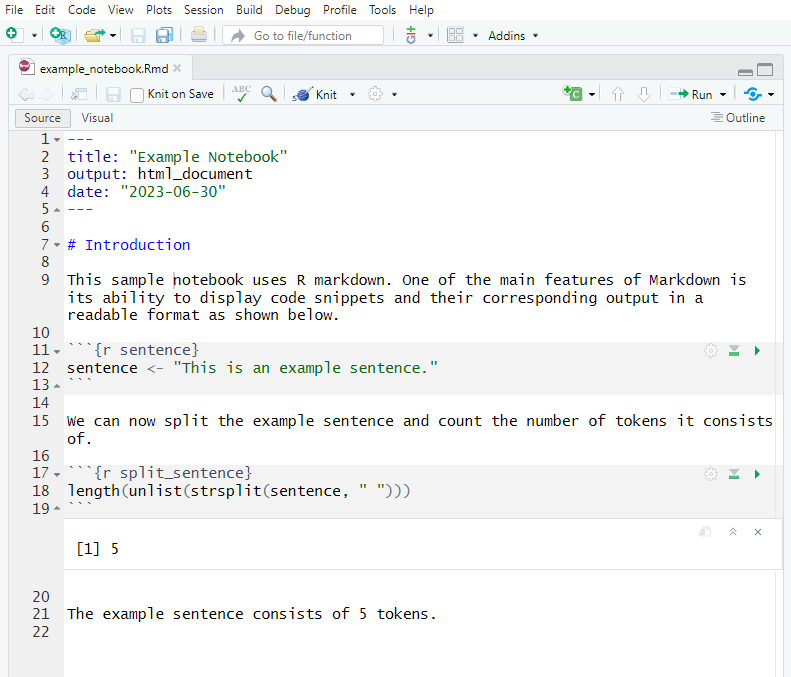
Notebooks offer several advantages for facilitating transparent and reproducible research in corpus linguistics. They have the capability to be rendered into PDF format, enabling easy sharing with reviewers and fellow researchers. This allows others to scrutinise the analysis process step by step. Additionally, the reporting feature of notebooks permits other researchers to replicate the same analysis with minimal effort, provided that the necessary data is accessible. As such, notebooks provide others with the means to thoroughly understand and replicate an analysis at the click of a button (Schweinberger and Haugh 2025).
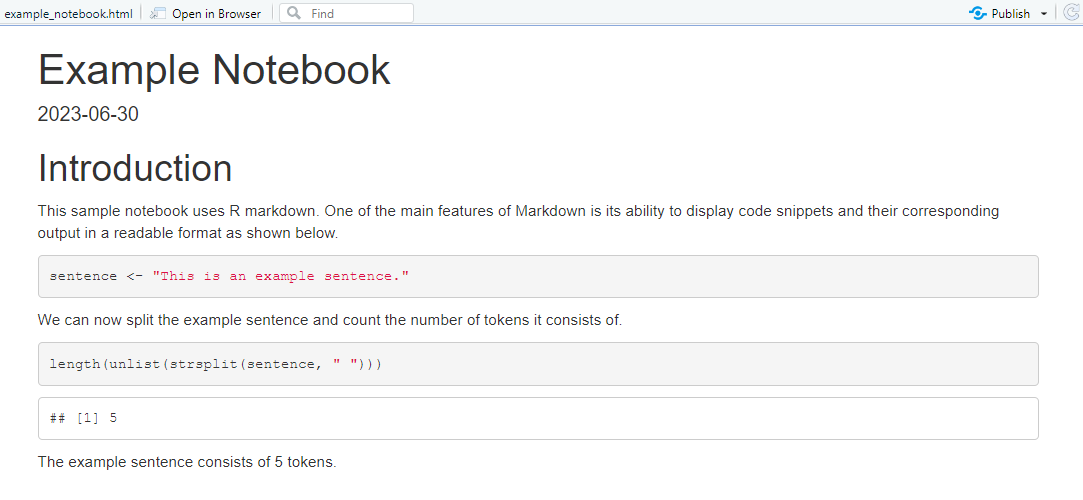
Furthermore, while notebooks are commonly used for documenting quantitative and computational analyses, recent studies have demonstrated their efficacy in rendering qualitative and interpretative work in corpus pragmatics (Schweinberger and Haugh 2025) and corpus-based discourse analysis (see Bednarek, Schweinberger, and Lee 2024) more transparent. Notebooks, particularly interactive notebooks, enhance accountability by facilitating data exploration and enabling others to verify the reliability and accuracy of annotation schemes.
Sharing notebooks offers an additional advantage compared to sharing files containing only code. While code captures the logic and instructions for analysis, it lacks the output generated by the code, such as visualisations or statistical models. Reproducing analyses solely from code necessitates specific coding expertise and replicating the software environment used for the original analysis. This process can be challenging, particularly for analyses reliant on diverse software applications, versions, and libraries, especially for researchers lacking strong coding skills. In contrast, rendered notebooks display both the analysis steps and the corresponding code output, eliminating the need to recreate the output locally. Moreover, understanding the code in the notebook typically requires only basic comprehension of coding concepts, enabling broader accessibility to the analysis process.
Version control (Git)
Implementing version control systems, such as Git, helps track changes in code and data over time. The primary issue that version control applications address is the dependency of analyses on specific versions of software applications. What may have worked and produced a desired outcome with one version of a piece of software may no longer work with another version. Thus, keeping track of versions of software packages is crucial for sustainable reproducibility. Additionally, version control extends to tracking different versions of reports or analytic steps, particularly in collaborative settings (Blischak, Davenport, and Wilson 2016).

Version control facilitates collaboration by allowing researchers to revert to previous versions if necessary and provides an audit trail of the data processing, analysis, and reporting steps. It enhances transparency by capturing the evolution of the research project. Version control systems, such as Git, can be utilised to track code changes and facilitate collaboration (Blischak, Davenport, and Wilson 2016).
RStudio has built-in version control and also allows direct connection of projects to GitHub repositories. GitHub is a web-based platform and service that provides a collaborative environment for software development projects. It offers version control using Git, a distributed version control system, allowing developers to track changes to their code, collaborate with others, and manage projects efficiently. GitHub also provides features such as issue tracking, code review, and project management tools, making it a popular choice for both individual developers and teams working on software projects.
Uploading and sharing resources (such as notebooks, code, annotation schemes, additional reports, etc.) on repositories like GitHub (https://github.com/) (Beer 2018) ensures long-term preservation and accessibility, thereby ensuring that the research remains available for future analysis and verification. By openly sharing research materials on platforms like GitHub, researchers enable others to access and scrutinise their work, thereby promoting transparency and reproducibility.
Digital Object Identifier (DOI) and Persistent identifier (PiD)
Once you’ve completed your project, help make your research data discoverable, accessible and possibly re-usable using a PiD such as a DOI! A Digital Object Identifier (DOI) is a unique alphanumeric string assigned by either a publisher, organisation or agency that identifies content and provides a PERSISTENT link to its location on the internet, whether the object is digital or physical. It might look something like this http://dx.doi.org/10.4225/01/4F8E15A1B4D89.

DOIs are considered a type of persistent identifiers (PiDs). An identifier is any label used to name some thing uniquely (whether digital or physical). URLs are an example of an identifier. So are serial numbers, and personal names. A persistent identifier is guaranteed to be managed and kept up to date over a defined time period.
Journal publishers assign DOIs to electronic copies of individual articles. DOIs can also be assigned by an organisation, research institute or agency and are generally managed by the relevant organisation and relevant policies. DOIs not only uniquely identify research data collections, they also support citation and citation metrics.
A DOI will also be given to any data set published in UQ eSpace, whether added manually or uploaded from UQ RDM. For information on how to cite data, have a look here.
Key points
DOIs are a persistent identifier and as such carry expectations of curation, persistent access and rich metadata
DOIs can be created for DATA SETS and associated outputs (e.g. grey literature, workflows, algorithms, software etc) - DOIs for data are equivalent to DOIs for other scholarly publications
DOIs enable accurate data citation and bibliometrics (both metrics and altmetrics)
Resolvable DOIs provide easy online access to research data for discovery, attribution and reuse
GOING FURTHER
For Beginners
- Ensure data you associate with a publication has a DOI- your library is the best group to talk to for this.
For Intermediates
Learn more about how your DOI can potentially increase your citation rates by watching this 4m:51s video
Learn more about how your DOI can potentially increase your citation rate by reading the ANDS Data Citation Guide
For Advanced identifiers
Citation & Session Info
Schweinberger, Martin. 2024. Introduction to Data Management. Brisbane: The University of Queensland. url: https://ladal.edu.au/tutorials/datamanage/datamanage.html (Version 2025.08.01).
@manual{schweinberger2025datamanage,
  author = {Schweinberger, Martin},
  title = {Introduction to Data Management},
  note = {tutorials/datamanage/datamanage.html},
  year = {2025},
  organization = {The University of Queensland, School of Languages and Cultures},
  address = {Brisbane},
  edition = {2025.08.01}
}
R version 4.4.3 (2025-02-28)
Platform: x86_64-apple-darwin20
Running under: macOS Sequoia 15.7.2

Matrix products: default
BLAS:   /Library/Frameworks/R.framework/Versions/4.4-x86_64/Resources/lib/libRblas.0.dylib
LAPACK: /Library/Frameworks/R.framework/Versions/4.4-x86_64/Resources/lib/libRlapack.dylib;  LAPACK version 3.12.0

locale:
[1] en_AU.UTF-8/en_AU.UTF-8/en_AU.UTF-8/C/en_AU.UTF-8/en_AU.UTF-8

time zone: Australia/Sydney
tzcode source: internal

attached base packages:
[1] stats     graphics  grDevices datasets  utils     methods   base

loaded via a namespace (and not attached):
 [1] htmlwidgets_1.6.4 compiler_4.4.3    fastmap_1.2.0     cli_3.6.5
 [5] htmltools_0.5.8.1 tools_4.4.3       yaml_2.3.10       rmarkdown_2.29
 [9] knitr_1.49        jsonlite_2.0.0    xfun_0.50         digest_0.6.37
[13] rlang_1.1.6       renv_1.1.4        evaluate_1.0.3
Back to top
Back to HOME
References
Bednarek, Monika, Martin Schweinberger, and Kelvin Lee. 2024.
“Corpus-Based Discourse Analysis: From Meta-Reflection to Accountability.” Corpus Linguistics and Linguistic Theory: Online First 0. https://doi.org/
https://doi.org/10.1515/cllt-2023-0104.
Beer, Brent. 2018. Introducing GitHub: A Non-Technical Guide. O’Reilly.
Blischak, John D, Emily R Davenport, and Greg Wilson. 2016. “A Quick Introduction to Version Control with Git and GitHub.” PLoS Computational Biology 12 (1): e1004668.
Corea, Francesco. 2019. An Introduction to Data: Everything You Need to Know about AI, Big Data and Data Science. Switzerland: Springer Nature Switzerland AG.
Heron, M., V. L. Hanson, and I. Ricketts. 2013. “Open Source and Accessibility: Advantages and Limitations.” Journal of Interaction Science 1: 1–10.
Jabrayilzade, E., M. Evtikhiev, E. Tüzün, and V. Kovalenko. 2022. “Bus Factor in Practice.” In Proceedings of the 44th International Conference on Software Engineering: Software Engineering in Practice, 97–106.
Pérez, Fernando, and Brian Granger. 2015. “The Jupyter Notebook: A System for Interactive Computing Across Media.” ACM SIGBED Review 12 (1): 55–60.
Pratt, Isaac. 2021. “Building a Data Management Plan for Your Research Project.” McMaster University.
Schweinberger, Martin, and Michael Haugh. 2025. “Reproducibility and Transparency in Interpretive Corpus Pragmatics.” International Journal of Corpus Linguistics.
Xie, Yihui. 2015. “R Markdown: Integrating a Reproducible Analysis Tool into Introductory Statistics.” Journal of Statistical Education 23 (3): 1–12.


